Climate Change ‘Tripled Chances’ of Hurricane Harvey’s Record Rain

By Daisy Dunne
When Hurricane Harvey struck Texas on Aug. 25, the state was hit by catastrophic flooding caused by record rainfall. In just three days, up to 40 inches (100 cm) of rain fell on Houston and its surrounding towns, leaving 80 dead and more than 100,000 homeless.
Now, scientists have calculated that those record rains were made at least three times more likely by climate change.
The analysis also shows that similarly extreme rainfall could become a further three times more likely to occur by the end of the century, even if global warming is limited to 2C.
If no efforts are made to stop the release of greenhouse gases, rainfall events on the same scale as Hurricane Harvey's downpour could become up to 10 times more likely by 2100, the research found.
The research was conducted by scientists at the World Weather Attribution project, which aims to assess the role of climate change in recent extreme events, such as droughts, heatwaves and floods.
Human Influence
At 10 p.m. on Friday Aug. 25, the category 4 Hurricane Harvey made landfall near Corpus Christi on the southern coast of Texas. By Saturday, it had arrived in Houston, dumping close to 40 inches of rain by Monday morning.
As news coverage tracked the path of Harvey across Texas, much of the coverage began to question how climate change could have influenced the chances of such a disaster.
Three months on, the new analysis, published in the journal Environmental Research Letters, attempts to address this question. It is what is known as a "single event attribution" study.
Single event attribution studies attempt to work out to what extent climate change could have influenced the likelihood of an extreme weather event, when other factors, such as natural climate variability, are also considered, explained lead author Dr. Geert Jan van Oldenborgh, from the Royal Netherlands Meteorological Institute. He told Carbon Brief:
After an extreme weather event, we always get the question: "To what extent was this due to climate change?" The almost identical question that an extreme event attribution study answers is "How much has the probability of an event changed due to climate change?"
In this case, we looked at the probability in the current climate of getting as much rain as fell on Houston or more, and compared it with the probability a century ago, from observations and climate models.
Eyeing the Storm
To understand the influence of climate change on Hurricane Harvey, the researchers decided to focus on how warming could have influenced its record-breaking rains, rather than on how warming could have affected the chances of the hurricane forming, said van Oldenborgh:
We explicitly do not attribute tropical storms in this study, only the precipitation from all causes, among them tropical storms.
This is partly because it is more difficult to simulate the behavior of hurricanes in climate models than other extreme weather events, such as heat waves and extreme rainfall, van Oldenborgh explained:
The typical spatial extent of a heatwave is many hundreds of kilometers, so you can represent a heatwave with a climate model with a resolution of 200km or so. However, critical parts of tropical storms [hurricanes and typhoons] are much smaller, you only start getting realistic simulations with 25km resolution models. Only recently have the models and computer capacities increased enough, but even then the details of the dynamics of the storms are still not completely well-represented.
Instead, the researchers chose to focus their analysis on rainfall in Texas between Aug. 26 and 28, which caused most of the catastrophic flooding. For this analysis, the scientists collected rainfall readings from weather stations across the Gulf Coast.
The charts below show the extent of these heavy rains over the three-day period. Chart A shows how the rate of rainfall in Houston changed over the three-day period, while chart B shows the total amount of rain that fell between Aug. 25 and 31.
Below this, chart C shows where the extreme rain was concentrated over the three-day period across the Gulf Coast, with dark blue representing high amounts of rain and yellow showing low. Chart D shows the spread of rainfall that is associated with annual average three-day maximum for the Gulf Coast.
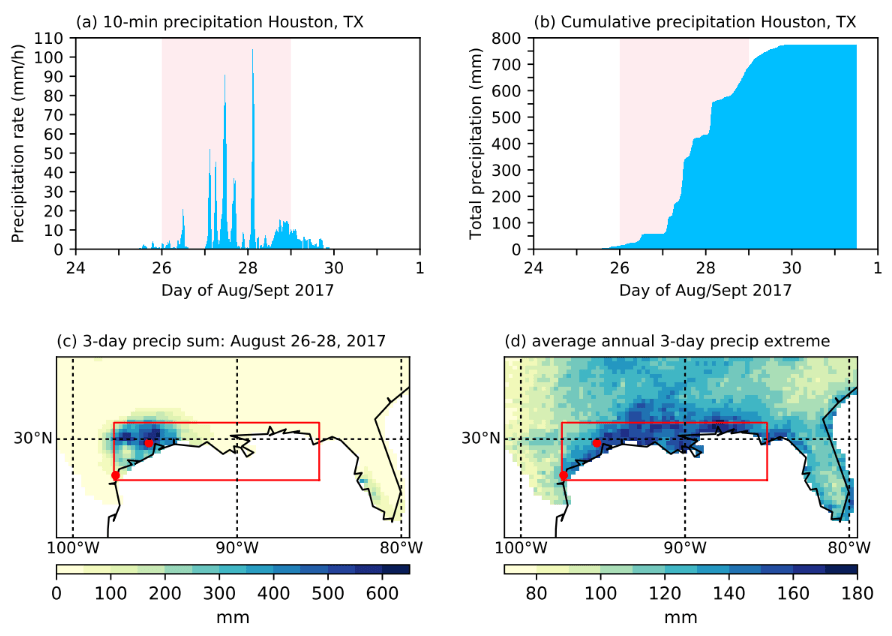
van Oldenborgh et al. (2017)
A: The rate of rainfall over Houston from Aug. 26-28. B: Total amount of rainfall in Houston from Aug. 26-31. C: Spatial concentration of rainfall over the Gulf Coast from Aug. 26-28, with dark blue showing high rainfall and yellow showing low. D: Spread of rainfall that is associated with annual average three-day maximum for the Gulf Coast.
Human Fingerprint
To understand the influence of climate change on extreme rainfall, the researchers first compared their data to historical rainfall records dating back to the last century.
This allowed the researchers to work out how the likelihood of an extreme rainfall event has changed in the last 100 years and how often it would be expected to occur in the current climate.
The analysis shows that rainfall events as extreme as during Hurricane Harvey are expected to affect Houston once every 9,000 years, said study coauthor Dr. Karin van der Wiel, from the Royal Netherlands Meteorological Institute. At the sidelines of the American Geophysical Union 2017 Fall Meeting, she told Carbon Brief:
[This event] was really, really rare. Locally, the return period was one in 9,000 years. Any city in the world would have flooded with that amount of rain. Regionally, for an event like this occur anywhere on the Gulf Coast, it was a one in a 100 year event, even that is quite extreme.
Next, the researchers compared their observations to the results of two climate models. For each model, the researchers ran two simulations: one assuming that there had been no climate change since the start of the industrial revolution and one assuming there had been moderate climate change since 1890.
Comparing the observations to the model results allowed the researchers to assess the extent to which climate change has made weather events such as Hurricane Harvey's record rainfall more likely.
The analysis suggests that Hurricane Harvey's downpour was made around three times more likely and 15 percent more intense by climate change.
The range of uncertainty around the results suggests that climate change made the event at least 1.5 times more likely and as much as five times more likely—and between 8 and 19 percent more intense.
This result is supported by a second independent study, published in the journal Geophysical Research Letters on Dec. 12, which finds Harvey's rainfall was made 3.5 times more likely by climate change.
The researchers also used the climate models to investigate how future global warming could affect the risk of extreme rainfall events by 2100.
The models show that, if future warming is limited to 2C, extreme rainfall events similar to Harvey could become another three times more likely by the end of the century.
However, if the world fails to cut its rate of greenhouse gas emissions, extreme rainfall events could become another 10 times more likely, and increase in intensity by up to 50 percent.
Global warming could raise the chances of extreme rainfall in a number of ways, including by increasing the maximum moisture content of the air, explained van der Wiel:
There's many factors that have occurred in the climate system that made this event more likely to occur. So the sea surface temperature in the Gulf was extremely high, that was related to climate change. Atmospheric moisture is higher when it's warmer, so the atmosphere can hold more water so when it rains, it rains harder.
Planning Ahead
The research explores how climate change is making extreme rainfall events more likely and more intense, but it does not investigate other factors that can impact urban flood risk, van Oldenborgh said.
For example, issues such as urban planning and water management can also play a role in vulnerability to extreme rainfall. Despite this, the findings should prompt policymakers to recommit to curbing climate change, he said:
The flood risks depend also on the other factors that we mention, such as water management and building practices. However, floods also depend on precipitation and we now know that the probability of extreme precipitation will increase as the world warms. By how much indeed strongly depends on how far we allow the earth to warm further.
The findings are "significant" because they offer "a rather detailed analysis" of how climate change could affect rainfall in the Gulf Coast, said Dr. Peter Stott, head of the Climate Monitoring and Attribution team at the Met Office, who was not involved in the study. He told Carbon Brief:
What I think is lacking in this study however is a specific analysis of hurricanes. The study does not examine hurricanes in the climate models, as to whether they have become either more intense or more frequent, and therefore the conclusions of this paper are rather general in scope regarding extreme rainfall, which can be caused by a variety of mechanisms in addition to hurricanes.
Further work is therefore needed to look at hurricanes in more detail in order to determine how the risk of impacts specifically associated with hurricanes has changed.
Reposted with permission from our media associate Carbon Brief.
Thousands of Superfund sites exist around the U.S., with toxic substances left open, mismanaged and dumped. Despite the high levels of toxicity at these sites, nearly 21 million people live within a mile of one of them, according to the U.S. Environmental Protection Agency (EPA).
Currently, more than 1,300 Superfund sites pose a serious health risk to nearby communities. Based on a new study, residents living close to these sites could also have a shorter life expectancy.
Published in Nature Communications, the study, led by Hanadi S. Rifai, a professor of civil and environmental engineering at the University of Houston, and a team of researchers, found that living in nearby zip codes to Superfund sites resulted in a decreased life expectancy of more than two months, the University of Houston reported.
"We have ample evidence that contaminant releases from anthropogenic sources (e.g., petrochemicals or hazardous waste sites) could increase the mortality rate in fence-line communities," Rifai told the University of Houston. "Results showed a significant difference in life expectancy among census tracts with at least one Superfund site and their neighboring tracts with no sites."
The study pulled data from 65,000 census tracts – defined geographical regions – within the contiguous U.S., The Guardian reported. With this data, researchers found that for communities that are socioeconomically challenged, this life expectancy could decrease by up to a year.
"It was a bit surprising and concerning," Rifai told The Guardian. "We weren't sure [when we started] if the fact that you are socioeconomically challenged would make [the Superfund's effects] worse."
The research team, for example, found that the presence of a Superfund site in a census tract with a median income of less than $52,580 could reduce life expectancy by seven months, the University of Houston reported.
Many of these toxic sites were once used as manufacturing sites during the Second World War. Common toxic substances that are released from the sites into the air and surface water include lead, trichlorethylene, chromium, benzene and arsenic – all of which can lead to health impacts, such as neurological damage among children, The Union of Concerned Scientists wrote in a blog.
"The EPA has claimed substantial recent progress in Superfund site cleanups, but, contrary to EPA leadership's grandiose declarations, the backlog of unfunded Superfund cleanups is the largest it has been in the last 15 years," the Union wrote.
Delayed cleanup could become increasingly dangerous as climate change welcomes more natural hazards, like wildfires and flooding. According to a Government Accountability Office report, for example, climate change could threaten at least 60 percent of Superfund sites in the U.S., AP News reported.
During the summer of 2018, a major wildfire took over the Iron Mountain Superfund site near Redding, CA, ruining wastewater treatment infrastructure that is responsible for capturing 168 million gallons of acid mine drainage every month, NBC News reported.
"There was this feeling of 'My God. We ought to have better tracking of wildfires at Superfund locations,'" Stephen Hoffman, a former senior environmental scientist at the EPA, told NBC News. "Before that, there wasn't a lot of thought about climate change and fire. That has changed."
In the study, researchers also looked at the impacts of floodings on Superfund sites, which could send toxins flowing into communities and waterways.
"When you add in flooding, there will be ancillary or secondary impacts that can potentially be exacerbated by a changing future climate," Rifai told the University of Houston. "The long-term effect of the flooding and repetitive exposure has an effect that can transcend generations."
- Biden Faces Pressure to Tackle 'Unfunded' Toxic Waste Sites ... ›
- Do You Live Near One of the 1,300 Most Toxic Sites in America ... ›
- EPA Adds Prison Locations to Its Environmental Justice Mapping ... ›
- EPA: Houston Superfund Site Leaked Toxic Chemicals After Harvey ... ›
A weather research station on a bluff overlooking the sea is closing down because of the climate crisis.
The National Weather Service (NWS) station in Chatham, Massachusetts was evacuated March 31 over concerns the entire operation would topple into the ocean.
"We had to say goodbye to the site because of where we are located at the Monomoy Wildlife Refuge, we're adjacent to a bluff that overlooks the ocean," Boston NWS meteorologist Andy Nash told WHDH at the time. "We had to close and cease operations there because that bluff has significantly eroded."
Chatham is located on the elbow of Cape Cod, a land mass extending out into the Atlantic Ocean that has been reshaped and eroded by waves and tides over tens of thousands of years, The Guardian explained. However, sea level rise and extreme weather caused by the climate crisis have sped that change along.
"It's an extremely dynamic environment, which is obviously a problem if you are building permanent infrastructure here," Andrew Ashton, an associate scientist at Cape-Cod based Woods Hole Oceanographic Institution, told The Guardian. "We are putting our foot on the accelerator to make the environment even more dynamic."
This was the case with the Chatham weather station. It used to be protected from the drop into the ocean by about 100 feet of land. However, storm action in 2020 alone washed away as much as six feet of land a day.
"We'd know[n] for a long time there was erosion but the pace of it caught everyone by surprise," Nash told The Guardian. "We felt we had maybe another 10 years but then we started losing a foot of a bluff a week and realized we didn't have years, we had just a few months. We were a couple of storms from a very big problem."
The Chatham station was part of a network of 92 NWS stations that monitor temperature, pressure, humidity, wind speed and direction and other data in the upper atmosphere, The Cape Cod Chronicle explained. The stations send up radiosondes attached to weather balloons twice a day to help with weather research and prediction. The Chatham station, which had been observing this ritual for the past half a century, sent up its last balloon the morning of March 31.
"We're going to miss the observations," Nash told The Cape Cod Chronicle. "It gives us a snapshot, a profile of the atmosphere when the balloons go up."
The station was officially decommissioned April 1, and the two buildings on the site will be demolished sometime this month. The NWS is looking for a new location in southeastern New England. In the meantime, forecasters will rely on data from stations in New York and Maine.
Nash said the leavetaking was bittersweet, but inevitable.
"[M]other nature is evicting us," he told The Cape Cod Chronicle.
By Douglas Broom
- If online deliveries continue with fossil-fuel trucks, emissions will increase by a third.
- So cities in the Netherlands will allow only emission-free delivery vehicles after 2025.
- The government is giving delivery firms cash help to buy or lease electric vehicles.
- The bans will save 1 megaton of CO2 every year by 2030.
Cities in the Netherlands want to make their air cleaner by banning fossil fuel delivery vehicles from urban areas from 2025.
"Now that we are spending more time at home, we are noticing the large number of delivery vans and lorries driving through cities," said Netherlands environment minister Stientje van Veldhoven, announcing plans to ban all but zero-emission deliveries in 14 cities.
"The agreements we are setting down will ensure that it will be a matter of course that within a few years, supermarket shelves will be stocked, waste will be collected, and packages will arrive on time, yet without any exhaust fumes and CO2 emissions," she added.
She expects 30 cities to announce zero emission urban logistics by this summer. City councils must give four years' notice before imposing bans as part of government plans for emission-free road traffic by 2050. The city bans aim to save 1 megaton of CO2 each year by 2030.
Help to Change
To encourage transport organizations to go carbon-free, the government is offering grants of more than US$5,900 to help businesses buy or lease electric vehicles. There will be additional measures to help small businesses make the change.
The Netherlands claims it is the first country in the world to give its cities the freedom to implement zero-emission zones. Amsterdam, Rotterdam and Utrecht already have "milieuzones" where some types of vehicles are banned.
Tilburg, one of the first wave of cities imposing the Dutch ban, will not allow fossil-fuelled vehicles on streets within its outer ring road and plans to roll out a network of city-wide electric vehicle charging stations before the ban comes into effect in 2025.
"Such initiatives are imperative to improve air quality. The transport of the future must be emission-free, sustainable, and clean," said Tilburg city alderman Oscar Dusschooten.
Europe Takes Action
Research by Renault shows that many other European cities are heading in the same direction as the Netherlands, starting with Low Emission Zones of which Germany's "Umweltzone" were pioneers. More than 100 communes in Italy have introduced "Zonas a traffico limitato."
Madrid's "zona de baja emisión" bans diesel vehicles built before 2006 and petrol vehicles from before 2000 from central areas of the city. Barcelona has similar restrictions and the law will require all towns of more than 50,000 inhabitants to follow suit.
Perhaps the most stringent restrictions apply in London's Ultra Low Emission Zone (ULEZ), which charges trucks and large vehicles up to US$137 a day to enter the central area if they do not comply with Euro 6 emissions standards. From October, the ULEZ is being expanded.
Cities are responsible for around 75% of CO2 emissions from global final energy use, according to the green thinktank REN21 - and much of these come from transport. Globally, transport accounts for 24% of world CO2 emissions.
The Rise of Online Shopping
Part of the reason for traffic in urban areas is the increase in delivery vehicles, as online shopping continues to grow. Retailer ecommerce sales are expected to pass $5billion in 2022, according to eMarketer.
The World Economic Forum's report The Future of the Last-Mile Ecosystem, published in January 2020, estimates that e-commerce will increase the number of delivery vehicles on the roads of the world's 100 largest cities by 36% by 2030.
If all those vehicles burn fossil fuels, the report says emissions will increase by 32%. But switching to all-electric delivery vehicles would cut emissions by 30% from current levels as well as reducing costs by 25%, the report says.
Other solutions explored in the report include introducing goods trams to handle deliveries alongside their passenger-carrying counterparts and increased use of parcel lockers to reduce the number of doorstep deliveries.
Reposted with permission from the World Economic Forum.
A bill that would have banned fracking in California died in committee Tuesday.
The bill, SB467, would have prohibited fracking and other controversial forms of oil extraction. It would also have banned oil and gas production within 2,500 feet of a home, school, hospital or other residential facility. The bill originally set the fracking ban for 2027, but amended it to 2035, The AP reported.
"Obviously I'm very disappointed," State Sen. Scott Wiener (D-San Francisco), one of the bill's two introducers, told the Los Angeles Times. "California really has not done what it needs to do in terms of addressing the oil problem. We have communities that are suffering right now, and the Legislature has repeatedly failed to act."
The bill was introduced after California Gov. Gavin Newsom said he would sign a fracking ban if it passed the legislature, though his administration has continued to issue permits in the meantime, Forbes reported. Newsom has also spoken in favor of a buffer zone between oil and gas extraction and places where people live and learn, according to the Los Angeles Times. The latter is a major environmental justice issue, as fossil fuel production is more likely to be located near Black and Latinx communities.
Urban lawmakers who want California to lead on the climate crisis supported the bill, while inland lawmakers in oil-rich areas concerned about jobs opposed it. The oil and gas industry and trade unions also opposed the bill.
This opposition meant the bill failed to get the five votes it needed to move beyond the Senate's Natural Resources and Water Committee. Only four senators approved it, while Democrat Sen. Susan Eggman of Stockton joined two Republicans to oppose it, and two other Democrats abstained.
Eggman argued that the bill would have forced California to rely on oil extracted in other states.
"We're still going to use it, but we're going to use it from places that produce it less safely," Eggman told The AP. She also said that she supported the transition away from fossil fuels, but thought the bill jumped the gun. "I don't think we're quite there yet, and this bill assumes that we are," she added.
Historically, California has been a major U.S. oil producer. Its output peaked in 1986 at 1.1 million barrels a day, just below Texas and Alaska, according to Forbes. However, production has declined since then making it the seventh-most oil-producing state.
Still, California's fossil fuel industry is at odds with state attempts to position itself as a climate leader.
"There is a large stain on California's climate record, and that is oil," Wiener said Tuesday, according to The AP.
Wiener and Democrat co-introducer Sen. Monique Limón from Santa Barbara vowed to keep fighting.
"While we saw this effort defeated today, this issue isn't going away," they wrote in a joint statement. "We'll continue to fight for aggressive climate action, against harmful drilling, and for the health of our communities."
- What the Industry Doesn't Want You to Know About Fracking ... ›
- Final EPA Study Confirms Fracking Contaminates Drinking Water ... ›
- Pennsylvania Fracking Water Contamination Much Higher Than ... ›
World's 5% 'Polluter Elite' Responsible for 37% of Global Emissions Growth, Study Concludes
By Brett Wilkins
As world leaders prepare for this November's United Nations Climate Conference in Scotland, a new report from the Cambridge Sustainability Commission reveals that the world's wealthiest 5% were responsible for well over a third of all global emissions growth between 1990 and 2015.
The report, Changing Our Ways: Behavior Change and the Climate Crisis, found that nearly half the growth in absolute global emissions was caused by the world's richest 10%, with the most affluent 5% alone contributing 37%.
"In the year when the UK hosts COP26, and while the government continues to reward some of Britain's biggest polluters through tax credits, the commission report shows why this is precisely the wrong way to meet the UK's climate targets," the report's introduction states.
The authors of the report urge United Kingdom policymakers to focus on this so-called "polluter elite" in an effort to persuade wealthy people to adopt more sustainable behavior, while providing "affordable, available low-carbon alternatives to poorer households."
The report found that the "polluter elite" must make "dramatic" lifestyle changes in order to meet the UK's goal — based on the Paris climate agreement's preferential objective — of limiting global heating to 1.5°C, compared with pre-industrial levels.
In addition to highlighting previous recommendations — including reducing meat consumption, reducing food waste, and switching to electric vehicles and solar power — the report recommends that policymakers take the following steps:
- Implement frequent flyer levies;
- Enact bans on selling and promoting SUVs and other high polluting vehicles;
- Reverse the UK's recent move to cut green grants for homes and electric cars; and
- Build just transitions by supporting electric public transport and community energy schemes.
"We have got to cut over-consumption and the best place to start is over-consumption among the polluting elites who contribute by far more than their share of carbon emissions," Peter Newell, a Sussex University professor and lead author of the report, told the BBC.
"These are people who fly most, drive the biggest cars most, and live in the biggest homes which they can easily afford to heat, so they tend not to worry if they're well insulated or not," said Newell. "They're also the sort of people who could really afford good insulation and solar panels if they wanted to."
Newell said that wealthy people "simply must fly less and drive less. Even if they own an electric SUV, that's still a drain on the energy system and all the emissions created making the vehicle in the first place."
"Rich people who fly a lot may think they can offset their emissions by tree-planting schemes or projects to capture carbon from the air," Newell added. "But these schemes are highly contentious and they're not proven over time."
The report concludes that "we are all on a journey and the final destination is as yet unclear. There are many contradictory road maps about where we might want to get to and how, based on different theories of value and premised on diverse values."
"Promisingly, we have brought about positive change before, and there are at least some positive signs that there is an appetite to do what is necessary to live differently but well on the planet we call home," it states.
The new report follows a September 2020 Oxfam International study that revealed the wealthiest 1% of the world's population is responsible for emitting more than twice as much carbon dioxide as the poorest 50% of humanity combined.
Reposted with permission from Common Dreams.
- Small Percentage of Frequent Flyers Are Driving Global Emissions ... ›
- World's Richest People Gained $1.8 Trillion in 2020 - EcoWatch ›
- Tourism Responsible for 8% of Global Greenhouse Gas Emissions ... ›