
 568k
568k  233k
233k  41k
41k  Subscribe
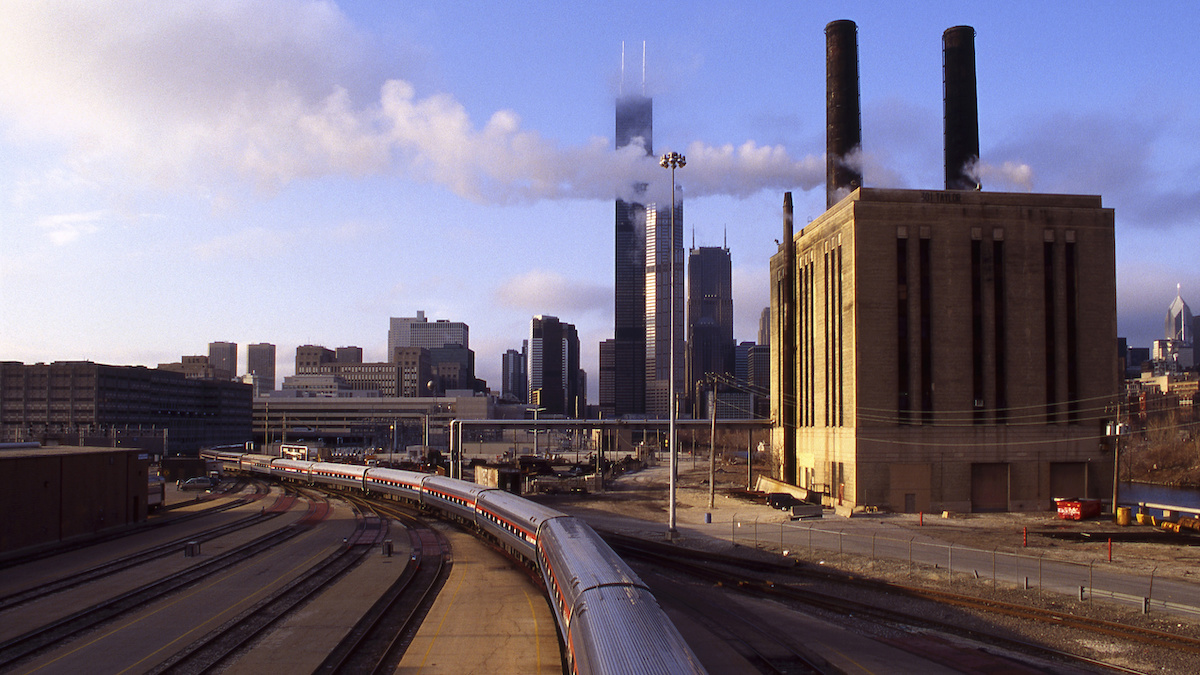
A power plant emits pollution next to a train in Chicago, Illinois. Arcaid / Universal Images Group / Getty Images
By Jeremy Deaton
The coronavirus is a case study in the limits of federalism. Where the federal government has declined to gather and distribute masks, gloves and ventilators, states and cities have been forced to compete for medical supplies, paying exorbitant prices to secure needed equipment. Where the federal government has been slow to ramp up testing, states and cities are struggling to conduct tests at the scale required to reopen business.
It is against this backdrop that 23 cities and counties, the U.S. Conference of Mayors, and the National League of Cities added their voice to a lawsuit challenging the Trump administration’s plan to weaken limits on carbon pollution from power plants. The document detailed how cities will struggle to cut carbon pollution without help from Washington.
“Cities can do a lot, but there are many ways in which the success of cities’ climate plans hinge on concerted federal action,” said Michael Burger, executive director of the Sabin Center for Climate Change Law at Columbia University, which worked with local leaders on a brief in support of the lawsuit. “I think that the fact that we were able to get this many cities to take the time necessary to give a final review to the brief, provide comments and get the final sign-off, indicates how important this issue really is.”
Burger said the project had taken on special significance as of late, given that people living in more polluted areas are more likely to die of the coronavirus. Notably, it is communities of color that are most likely to be under siege from both air pollution and the coronavirus, as well as worsening floods, storms and heat waves.
Civic leaders have limited means to cope with these inequities — a mayor can’t shut down a power plant that lies outside her jurisdiction, even if that power plant is sending pollution wafting over her city.
“The EPA’s irresponsible weakening of its rules to allow power plants to pollute more will increase air pollution, asthma rates, and the overall burden on public health services for cities like Las Cruces,” said Mayor Ken Miyagishima of Las Cruces, New Mexico, which signed onto the amicus brief. “At all levels of government, we need to be more vigilant about managing and reducing risks, whether it’s a pandemic or climate change.”
In 2007, the Supreme Court ruled that the Environmental Protection Agency had the authority to regulate heat-trapping gases. The agency later determined that it also had the obligation to do so. To fulfill that duty, the EPA under President Obama crafted the Clean Power Plan, a sweeping policy to limit carbon pollution from power plants.
President Trump, who has repeatedly called climate change a hoax, promised to do away with the Clean Power Plan in his 2016 campaign. He has since fulfilled that promise by replacing the policy with the Affordable Clean Energy rule, which does far less to limit pollution from power plants. Now, 22 states and the District of Columbia are suing the EPA for falling short of its legal duty to regulate carbon pollution.
While carbon dioxide poses little short-term threat to human health, it comes from the same power plants that produce mercury, sulfur dioxide and other pollutants linked to lung disease, heart disease, asthma and other maladies. Over the long term, carbon pollution is fueling deadly weather disasters like Hurricane Sandy and Hurricane Katrina. By the EPA’s own estimate, the Clean Power Plan promised to save as many as 4,500 lives a year by 2030. Its replacement would only save around 120 at the high end. That grim calculus has mayors, governors and business leaders eager to strengthen federal limits on carbon pollution.
“We don’t get to net zero in the United States without some kind of coordinated, comprehensive action by the federal government,” Burger said. “Whether it’s a public health crisis at this scale or the climate crisis, failures at the federal level lead inevitably to failures at the local level.”
Reposted with permission from Nexus Media.
- Trump's EPA Pick Hides Pro-Polluter Record Behind Process ...
- 'Fossil Fuel Companies Knew': Honolulu Files Lawsuit Over Climate ...
- Trump Admin Goes After States for Protecting the Environment ...