
 568k
568k  233k
233k  41k
41k  Subscribe
Could Iowa City one day join Copenhagen, Vancouver, Amsterdam, San Francisco and other climate action champions as one of the greenest cities in the world?
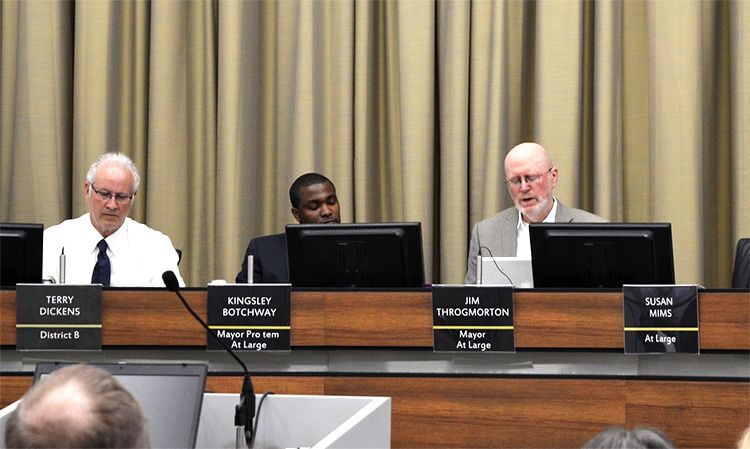
Declaring that cities must place “climate action as a central priority in strategic planning,” Iowa City Mayor Jim Throgmorton issued a “Regenerative City Day” proclamation on Tuesday at the Iowa City council meeting.
The breakthrough proclamation affirms that the city “must take decisive action” to “significantly reduce community-based greenhouse gas emissions” and recognizes the goals of a “regenerative city” to “replant native prairies and trees to store carbon in the soils; expand urban agriculture; to power our city and neighborhoods efficiently through green building designs and renewable energy; to expand city-wide recycling and composting through a zero waste ordinance; to make low-carbon transportation choices; to grow green jobs and support companies actively greening their operations.”
Emerging out of 15 months of community discussions, concerts and “Ecopolis” forums in Iowa City and nearby cities in the region, the regenerative city framework calls for a rethinking of urban designs in an age of climate change, restoration of native habitats and a shift toward dramatically ramped-up urban agriculture, renewable energy and viable urban development, especially for the area’s most vulnerable populations.
“We need to change the discussion from merely doing less bad to the environment to actively promoting environmental restoration, improving human health and quality of life by providing carbon free transportation choices and creating abundant sources of renewable energy,” said city council member Rockne Cole, one of the co-founders of the Ecopolis Forum.
“Iowa City must lead by example in these areas. This proclamation provides an important first step to becoming the first Regenerative City in the United States. I am excited about the working with community members to make this happen.”
The Proclamation was accepted in the city hall chambers by the popular Iowa City musical group, the Awful Purdies, who have played a key role in using the arts, music and storytelling in shaping community visioning events.
Often recognized in national surveys in the top 10 small cities for the arts, culture and education and notably a UNESCO “City of Literature,” Iowa City has sometimes lagged behind on various green indicators in the past. (While scoring high on economic, social and infrastructure categories, Iowa City received only 40 out of 100 points for climate and energy benchmarks in a recent STAR Community Rating System).
“I have heard the Awful Purdies sing this song several times, but today with this Proclamation, the lyrics have a strong, tangible meaning: Stop waiting for someone to open the door, We are the ones we have been waiting for,” said Miriam Alarcon, a co-founder of the Ecopolis Forums.
“I now look forward to the city releasing a request for proposals for solar energy power purchase agreements on municipal properties, like Johnson County,” said Miriam Alarcon, a co-founder of the Ecopolis Forums, “and considering a proposal for solar energy and energy efficiency mandates for new developments in the Riverfront Crossings District, which is finally emerging after being hit by record flooding in 2008.”
After a watershed election last fall, which brought in a progressive majority for the first time in nearly half a century, Iowa City recently signed on to the Compact of Mayors climate agreement and put forth a more ambitious strategic plan for sustainable development, especially in the areas of walkability and bicycling.
“Many city council members have expressed support for the vision of Iowa City as “Ecopolis,” the Midwest’s first regenerative city,” Iowa City resident and Rhodes Scholar Jeffrey Ding wrote last winter, who applauded the proclamation’s inclusion of a “zero waste” ordinance in the tradition of Oakland, California and Boulder, Colorado. “Recycling is an integral component of regeneration. I look forward to the city of Iowa City finally guaranteeing access to on-site recycling for all its residents.”
Other Ecopolis forums on regenerative city initiatives have included discussions for a major overhaul of urban farm and food policies, the development of public orchards and regenerative agriculture, a commitment to pesticide-free parks and public spaces and a soil carbon sequestration initiative through a major tree planting and native prairie restoration campaign.
City of Iowa City:
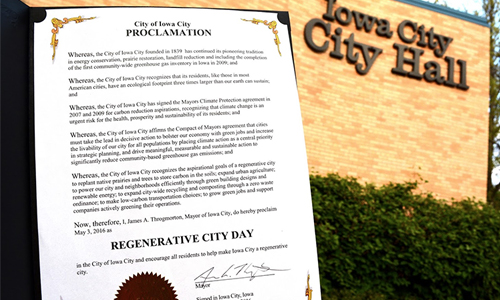
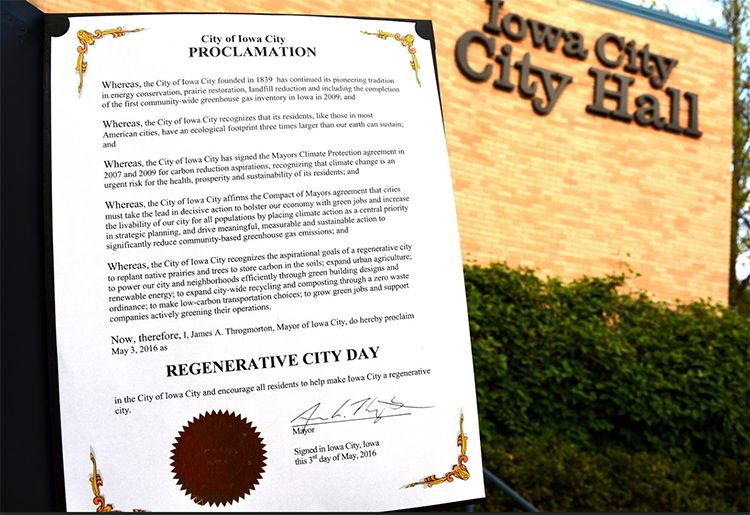
Proclamation
Whereas, the City of Iowa City founded in 1839 has continued its pioneering tradition in energy conservation, prairie restoration, landfill reduction and including the completion of the first community-wide greenhouse gas inventory in Iowa in 2009; and
Whereas, the City of Iowa City recognizes that its residents, like those in most American cities, have an ecological footprint three times larger than our earth can sustain; and
Whereas, the City of Iowa City has signed the Mayors Climate Protection agreement in 2007 and 2009 for carbon reduction aspirations, recognizing that climate change is an urgent risk for the health, prosperity and sustainability of its residents; and
Whereas, the City of Iowa City affirms the Compact of Mayors agreement that cities must take the lead in decisive action to bolster our economy with green jobs and increase the livability of our city for all populations by placing climate action as a central priority in strategic planning, and drive meaningful, measurable and sustainable action to significantly reduce community-based greenhouse gas emissions; and
Whereas, the City of Iowa City recognizes the aspirational goals of a regenerative city to replant native prairies and trees to store carbon in the soils; expand urban agriculture; to power our city and neighborhoods efficiently through green building designs and renewable energy; to expand city-wide recycling and composting through a zero waste ordinance; to make low-carbon transportation choices; to grow green jobs and support companies actively greening their operations.
Now, therefore, I, James A. Throgmorton, Mayor of Iowa City, do hereby proclaim May 3, 2016, as regenerative city day in the City of Iowa City and encourage all residents to help make Iowa City a regenerative city.
YOU MIGHT ALSO LIKE
An Open Letter to Charles Koch: Join Us in the Push Toward a Clean Energy Economy
Mark Ruffalo: New York State Leading the Way on the Clean Energy Revolution