
 568k
568k  233k
233k  41k
41k  Subscribe
By Brenda Ekwurzel
The 2017 Arctic Report Card reflects contributions from 85 scientists representing 12 countries. The pace of sea ice area (hereafter extent) decrease is unprecedented over the past 1,500 years, according to Emily Osborne’s et al. 2017 contribution to the Arctic Report Card released Tuesday.
Osborne and team carefully relied upon 45 different archives with a variety of yearly records (i.e. ice cores, tree rings and sediment cores) that provide information on air temperature, sea surface temperature and Arctic sea ice extent. Note that record ends at around 2,000.

Osborne, Cronin, and Farmer, 2017, Arctic Report Card (NOAA)
Sea ice extent, temperature anomaly, CO2 concentrations. Temperature anomalies show the fluctuations in temperature around a long-term mean; positive anomalies indicate warmer than average temperatures within a time series. The vertical dashed black line marks the start of the Industrial Revolution and global impacts of anthropogenic carbon emissions.
To see the latest story with sea ice extent observations, Don Perovich’s et al. 2017 contribution to the Arctic Report Card demonstrates it is not rebounding or recovering.
It is critical to track such unprecedented pace of change.
Navy Rear Admiral (Ret.) Timothy Gallaudet, acting NOAA administrator, highlighted the national security and economic reasons for closely tracking changes in the Arctic.
Gallaudet mentioned that NOAA is already taking action in terms of advancing our Earth system prediction and capability. Various departments depend on this information including Departments of Commerce, Agriculture and Defense.
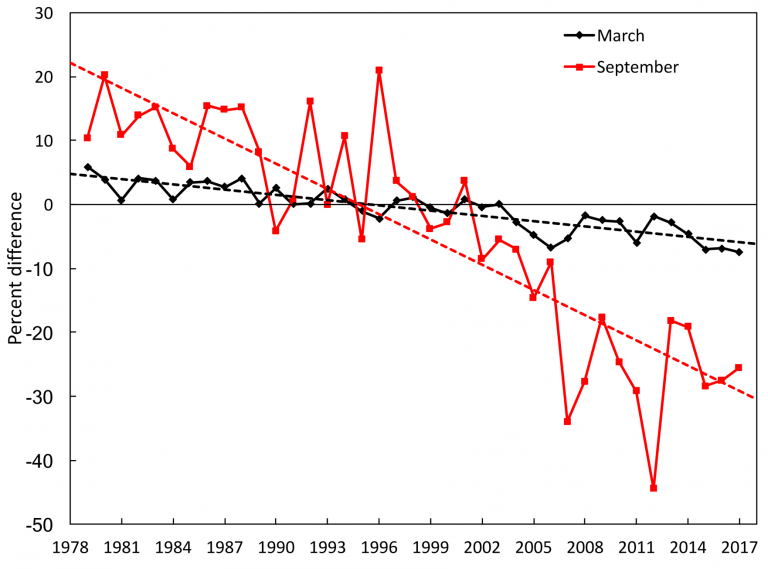
Perovich et al., 2017, Arctic Report Card (NOAA)
Time series of ice extent anomalies in March (maximum ice extent) and September (minimum ice extent). The anomaly value for each year is the difference (in percent) in ice extent relative to the mean values for the period 1981-2010. The black and red dashed lines are least squares linear regression lines. The slopes of these lines indicate ice losses of -2.7 percent and -13.2 percent per decade in March and September, respectively.
The longer-term perspective sure gives the impression of precipitous decline in Arctic Sea ice extent. Accordingly, there are many consequences associated with such a rapid pace of change.
Jeremy Mathis, director of NOAA’s Arctic Research Program noted that “the Arctic is among the most under observed places on the planet. The imperative is clear whether we are dealing with open ocean navigation, refugees or native hunters.”
Spanning a dozen years, NOAA, has consistently delivered a robust assessment of the Arctic. As we know, the world depends on this information because what happens in the Arctic influences coastlines around the world, extreme weather events in the Northern Hemisphere and more.
Brenda Ekwurzel is a senior climate scientist and the director of climate science at Union of Concerned Scientists.