
 568k
568k  233k
233k  41k
41k  Subscribe
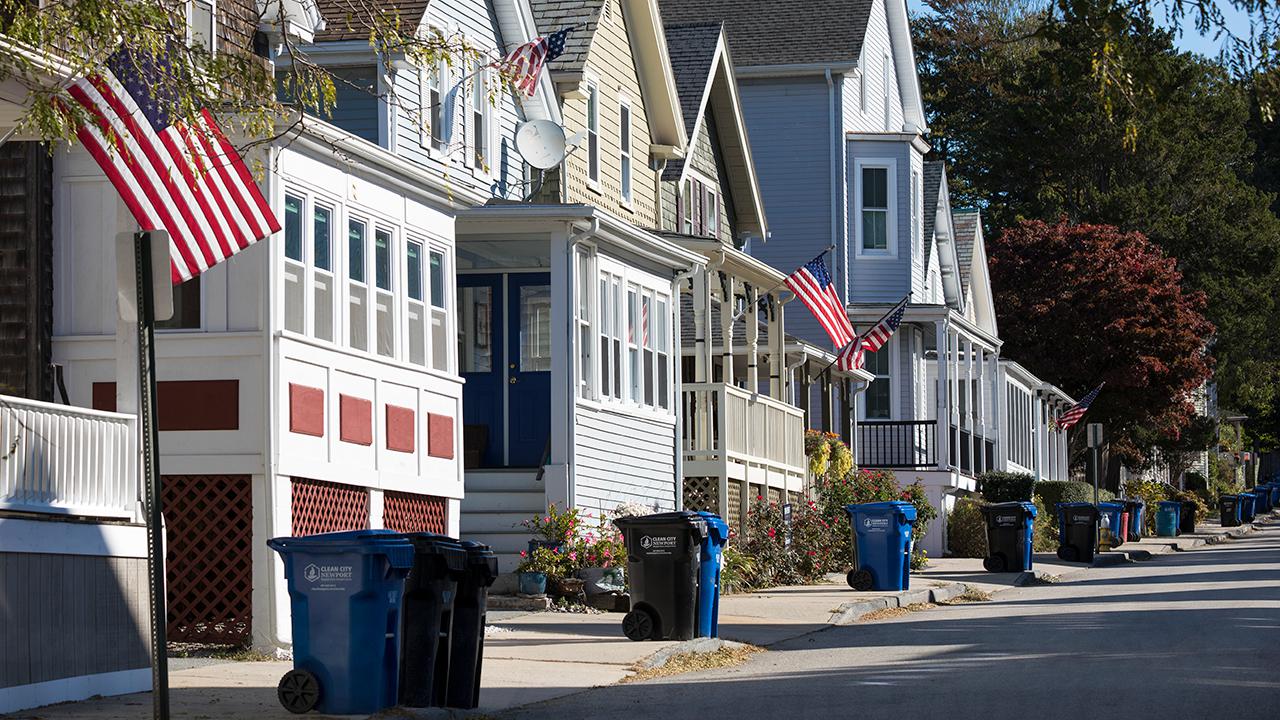
Recycling and general waste plastic wheelie bins awaiting collection for disposal in Newport, Rhode Island. Tim Graham / Getty Images
Reduce. Reuse. Recycle. According to The National Museum of American History, this popular slogan, with its iconic three arrows forming a triangle, embodied a national call to action to save the environment in the 1970s. In that same decade, the first Earth Day happened, the EPA was formed and Congress passed the Resource Conservation and Recovery Act, encouraging recycling and conservation of resources, Enviro Inc. reported.
According to Forbes, the Three R’s sustainability catch-phrase, and the recycling cause it bolstered, remain synonymous with the U.S. environmental movement itself. There’s only one problem: despite being touted as one of the most important personal actions that individuals can take to help the planet, “recycling” – as currently carried out in the U.S. – doesn’t work and doesn’t help.
Turns out, there is a vast divide between the misleading, popular notion of recycling as a “solution” to the American overconsumption problem and the darker reality of recycling as a failing business model.
The Myth: Recycling Began as a Plastics’ Industry Marketing Tactic
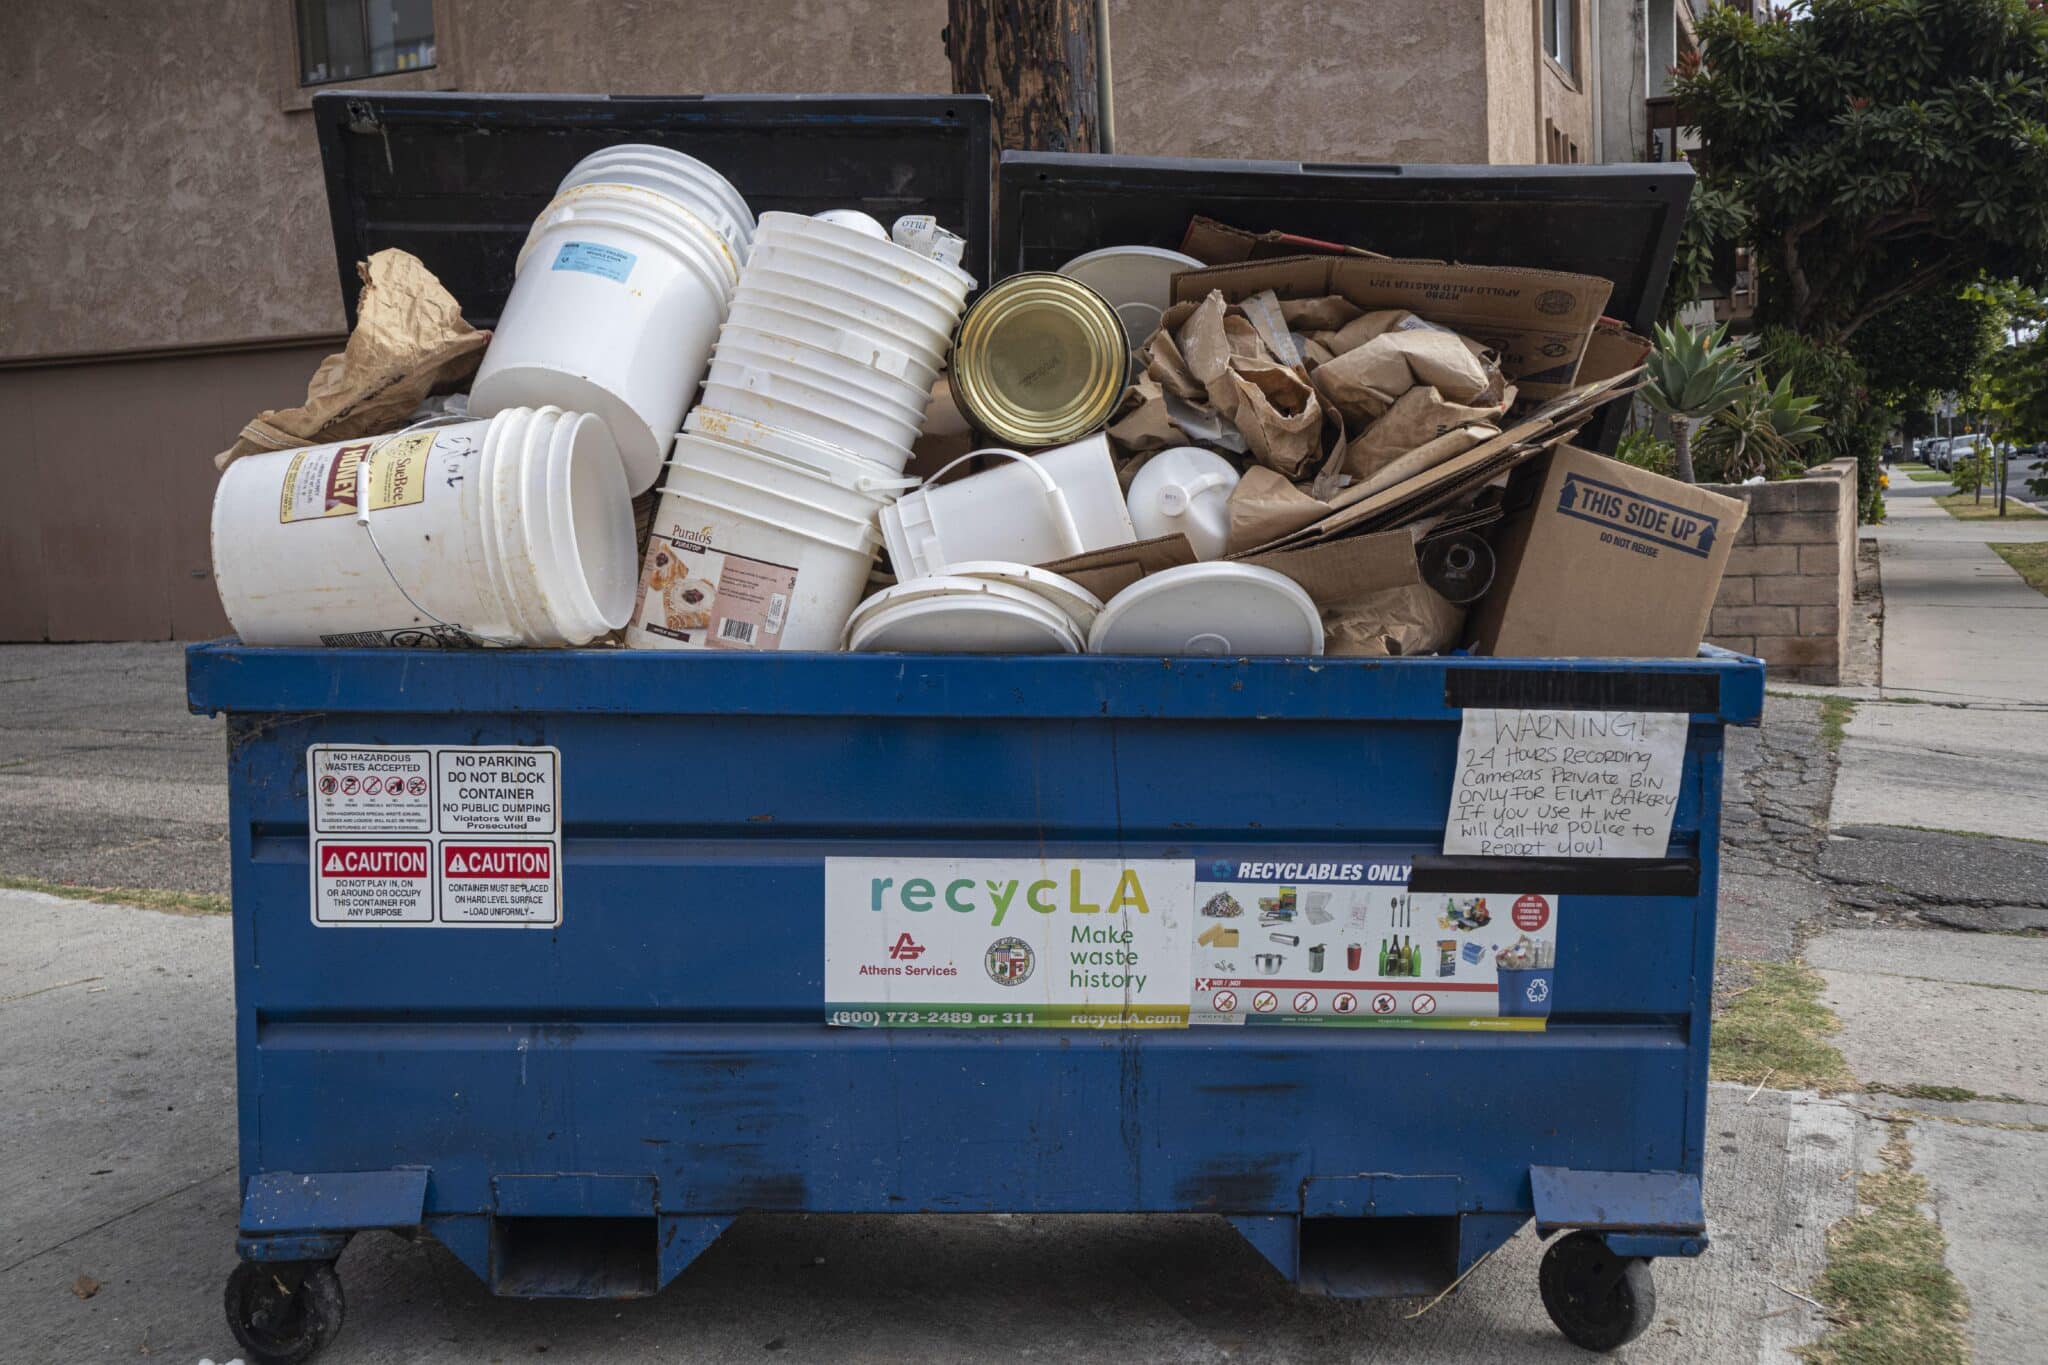
A recycling dumpster in Los Angeles. Citizen of the Planet / Education Images / Universal Images Group / Getty Images
When it was first introduced, recycling likely had altruistic motivations, Forbes reported. However, the system that emerged was never equipped to handle high volumes. Unfortunately, as consumption increased, so too did promotion of recycling as a solution. The system “[gave] manufacturers of disposable items a way to essentially market overconsumption as environmentalism,” Forbes reported. Then and now, “American consumers assuage any guilt they might feel about consuming mass quantities of unnecessary, disposable goods by dutifully tossing those items into their recycling bins and hauling them out to the curb each week.”
Little has changed since that Forbes article, titled “Can Recycling Be Bad For The Environment?,” was published almost a decade ago; increases in recycling have been eclipsed by much higher consumption rates. In fact, consumerism was at an all-time high in January 2020 before the pandemic hit, Trading Economics reported.
But, if the system doesn’t work, why does it continue? Turns out, consumers were misled – by the oil and gas industry. News reports from September 2020 revealed how the plastic industry-funded ads in the 1980s that heralded recycling as a panacea to our growing waste problem. These makers of virgin plastics were the biggest proponents and financial sponsors of plastic recycling programs because they created the illusion of a sustainable, closed-cycle while actually promoting the continued use of raw materials for new single-use plastics.
To the masses, these programs justified overconsumption and eased concerns over trash that could be thrown into recycling bins, Forbes reported. Generations of well-meaning Americans since the 1970’s and ’80’s – believing these communications masterminds – have dutifully used-then-recycled plastics and other materials. They trusted that their discards would be reborn as new goods instead of ending up in oceans and landfills.
The plastics industry went even further, lobbying 40 states to put the recycling triangle symbol on all plastic – even if it wasn’t recyclable, Houston Public Media reported. This bolstered the public image of plastic as a renewable resource, but the cost was clarity about what actually can be recycled. As recent as 2020, a Greenpeace report found that many U.S. products labeled as recyclable could not actually be processed by most domestic material recovery facilities.
The Reality: Most Recyclables Aren’t Being Recycled
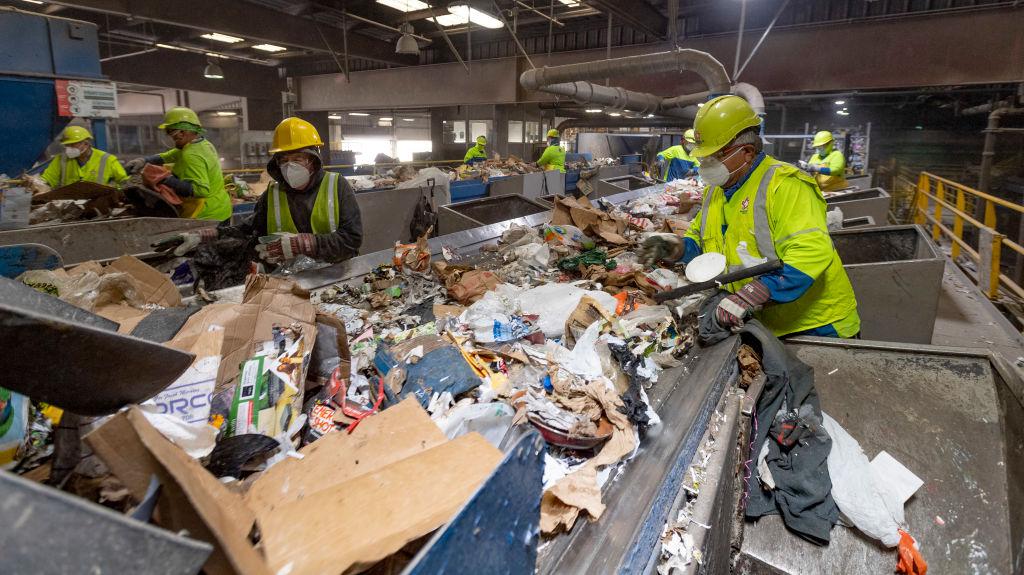
An initial pre-sort removes contaminates, items that can’t be recycled, at Republic Services in Anaheim, California on Thursday, April 15, 2021. Paul Bersebach / MediaNews Group / Orange County Register / Getty Images
The U.S. relies on single-stream recycling systems, in which recyclables of all sorts are placed into the same bin to be sorted and cleaned at recycling facilities. Well-meaning consumers are often over-inclusive, hoping to divert trash from landfills. Unfortunately, the trash often ends up there anyways – with the additional cost of someone at a recycling plant sorting through it.
The single-stream system is easier on consumers, but results in a mixed stream of materials that is easy to contaminate, hard to sort and more expensive to process. There are a variety of items – including dirty pizza boxes, old clothing, hangers, plastic bags, aerosols, batteries and electronics – that, if added to a residential recycling bin, will contaminate the entire batch of recyclables, a Miami recycling center representative told EcoWatch. At that point, it can be too costly and too dangerous for employees to hand-pick out erroneous items. Because these items cannot be processed in the same way as recyclable materials, their inclusion often means the whole batch will fetch a lower price from buyers or must be thrown away.
“Most people have the attitude that if they just put it in the blue bin, it will get taken away and somebody will figure out what to do with it, but putting something in the blue bin and actually recycling it are two very different things,” said David Biderman, CEO and executive director of the Solid Waste Association of North America.
Misunderstandings, misinformation and mislabeling aside, the harsh reality was and remains that most plastic can’t and won’t be recycled, reported NPR. For example, the EPA reported that plastic generation in 2018 was 35.7 million tons, accounting for 12.2 percent of municipal solid waste (MSW) that year. Of this total, only three million tons were recycled (an 8.7 percent recycling rate). The vast majority – 27 million tons – ended up in landfills, and the rest was combusted. The environmental agency also estimated that less than 10 percent of plastic thrown in bins in the last 40 years has actually been recycled.
The situation is slightly better for other recyclables, though they make up a smaller percentage of MSW. For example, glass products totaled 12.3 million tons in 2018, or 4.2 percent of the annual MSW generation. Almost 25 percent of glass was recycled, 61.6 percent ended up in landfills and 13.4 percent was combusted.
Post-consumer paper and cardboard for 2018 totaled 67.4 million tons, or 23.1 percent of total MSW generation for the year. The material also had the highest recycling rate of any other material in MSW – 68.2 percent. 25.6 percent of paper ended up in landfills and 6.23 percent was combusted.
According to this EPA data, recyclable plastics, glass and paper accounted for 18.5 percent, 5.2 percent and 11.8 percent of MSW landfilled in 2018, respectively. Those three materials alone comprised 35.5 percent of the total landfilled trash in the U.S. for the year; had they been properly collected, processed and purchased, they theoretically could have been diverted and recycled.
The Reason: Recycling Is Bad Business Around the World
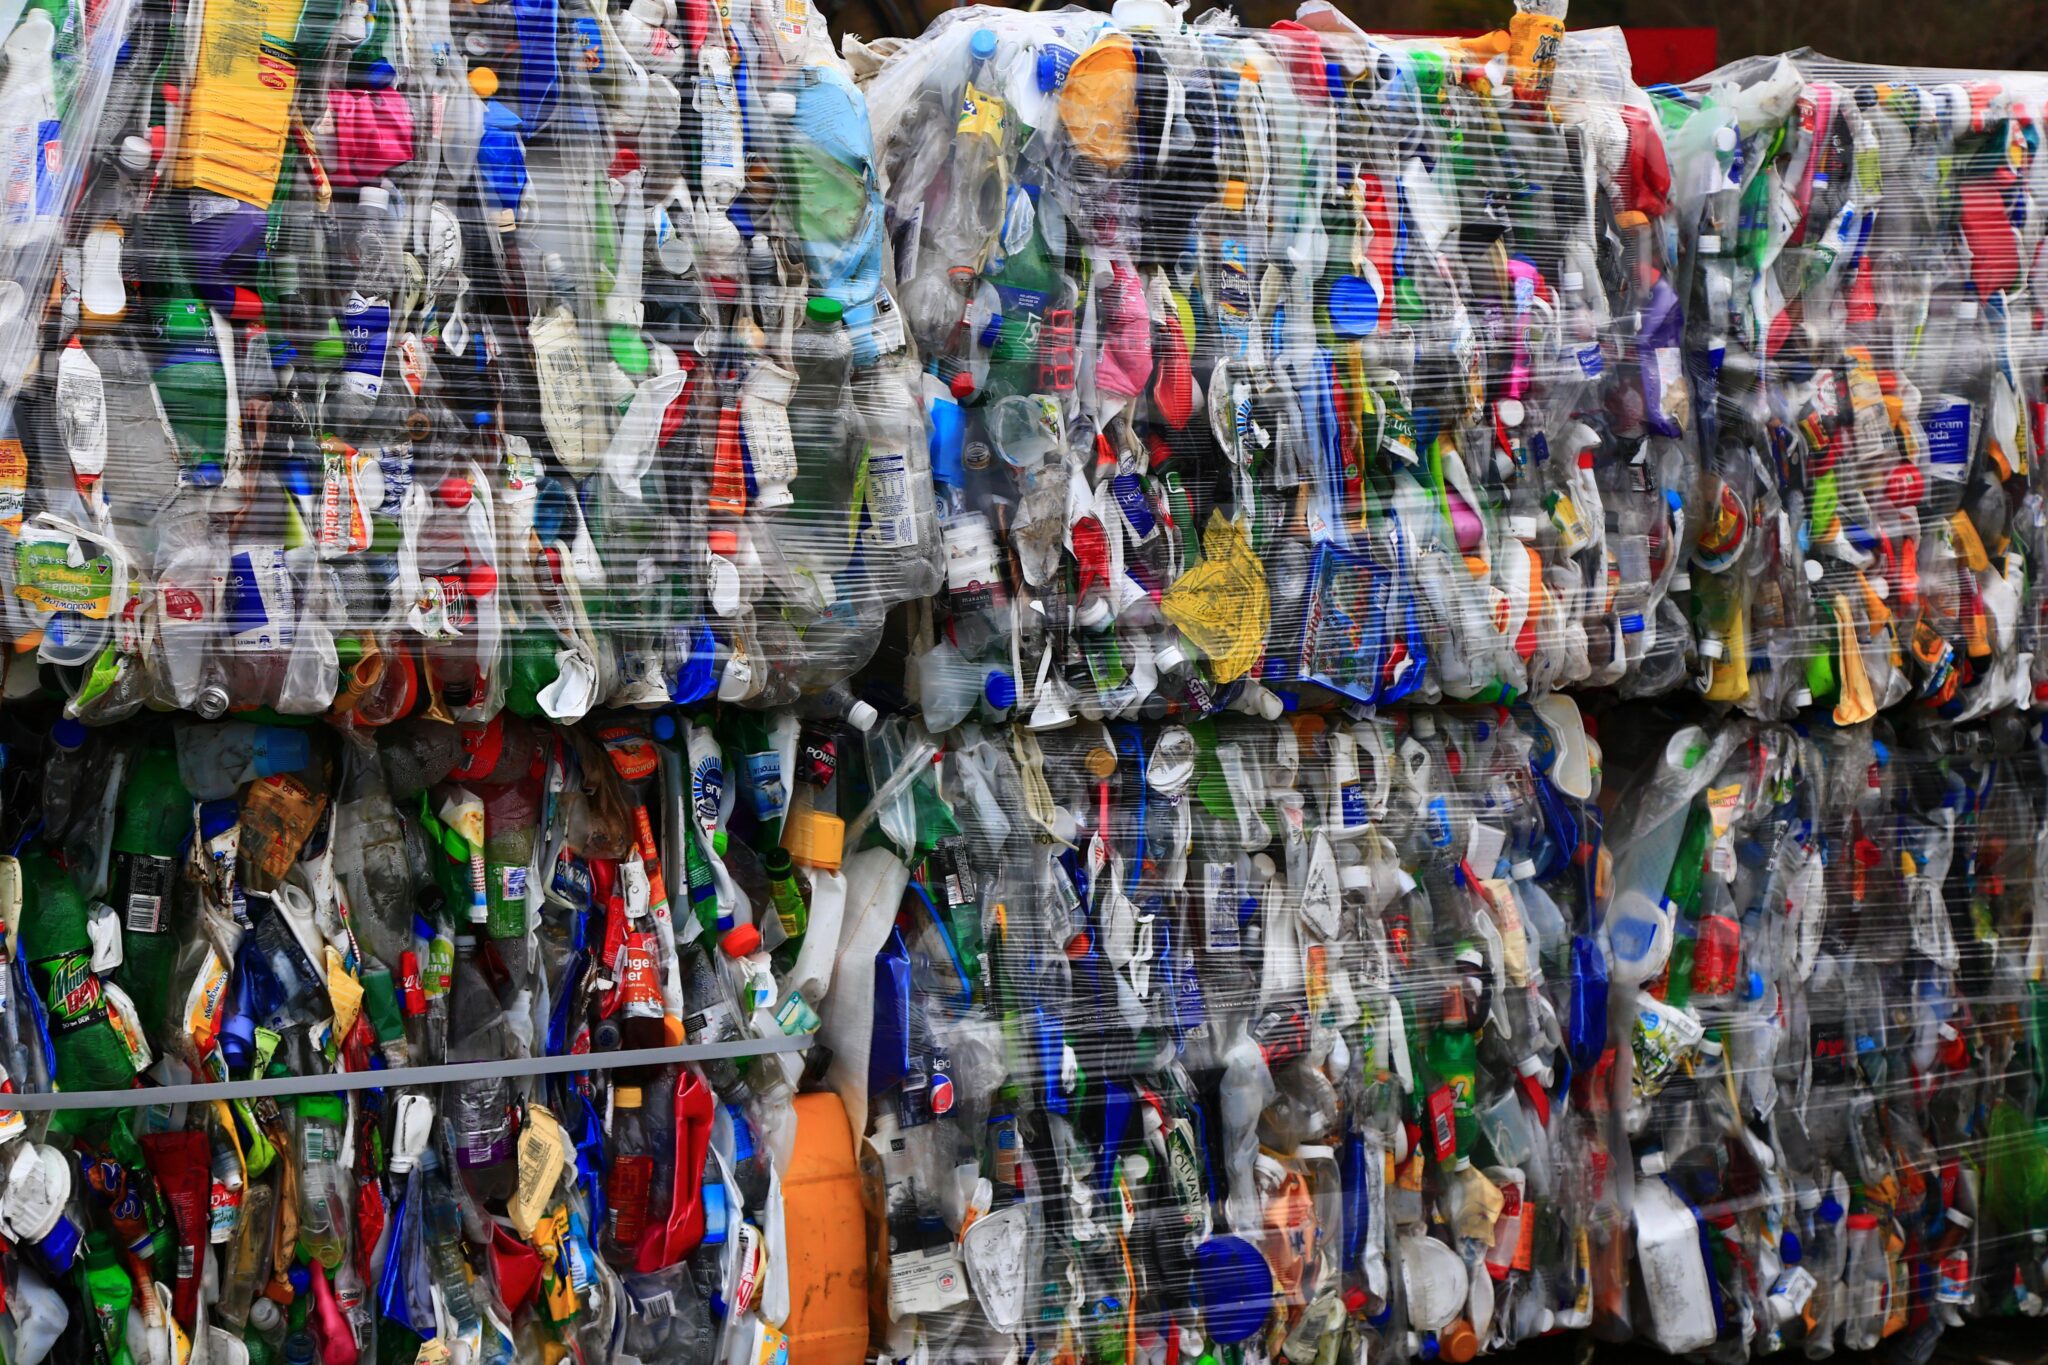
Recyclable waste must be sorted, cleaned and processed before it can be sold as a commodity on the open market. Nareeta Martin / Unsplash
Unfortunately, the EPA data also shows that 2018 was not an anomaly but rather another data point showing how the single-stream system in the U.S. has never been economically viable or feasible on a large scale. To further understand why recycling in America is failing, we need to think of recycled goods as commodities – because that’s what they are.
According to the recycling center representative, municipalities and counties pay for residential and commercial recyclables to be trucked to local and regional recycling plants for processing. Clean batches are sorted and/or compressed into bales of similar plastics, paper, aluminum or glass. The centers sell the cleaned recyclables on the open market to buyers who will process them into recycled materials like plastic pellets or post-consumer paper; these can be turned into new products.
This entire process – the processing and creation of saleable recycled goods – costs money. As with any good, profitability requires selling for a higher price than it costs to make. Contaminated batches are harder to process into new products and therefore fetch a lower price on the market, if they can be sold at all. Currently, U.S. recyclables are no longer profitable, and no one wants to buy them.
China used to buy the majority of the world’s plastics and paper for recycling, The New York Times reported. The U.S. has been the #1 generator of plastic waste in the world for years and used to ship more than half of its total plastic production to China, a November 2020 study found. The research also noted that up to one-fourth of American plastics sent abroad were contaminated or of poor quality, which would make it extremely difficult to recycle anyways.
Starting Jan. 1, 2018, China banned imports of most scrap materials because shipments were too contaminated, The Times reported; the country no longer wanted to be the “world’s garbage dump.”
As a result, the U.S. and other Western nations who had relied on China to offload their recyclables saw a “mounting crisis” of paper and plastic waste building up in ports and recycling facilities, The Times reported.
The Western nations began sending recyclable waste to other Southeast Asian countries like Vietnam, Indonesia, India and Malaysia. These countries often lacked the infrastructure to handle recyclables, so a lot of the waste ended up incinerated or landfilled
In response, in 2019, the United Nations passed an amendment to the Basel Convention hoping to protect the poor and developing countries who’d taken up China’s vacated role in the global recycling trade. The amendment ambitiously aimed to clean up the global trade in plastic waste, making it more transparent and better regulated and allowing developing countries to reject contaminated shipments. The U.S. did not ratify the amendment, and new evidence suggests it continues to send illegal and/or contaminated shipments to developing countries.
Domestically, the closing of the Chinese market to U.S. recyclables bankrupted many domestic recycling programs because there was too much supply and no real demand. The smaller Asian countries could not accept nearly as much as China had. Prices of recyclables dropped, and bales of scrap materials were sent to landfills and incinerators when they couldn’t be sold, another Times article reported.
This left waste-management companies around the country with no market for recyclabes, The Atlantic reported. They’ve been forced to go back to cities and municipalities with two choices: pay a lot more to get rid of their recycling or throw it away. The news report noted that most are choosing the latter.
“The economics are challenging,” agreed Nilda Mesa, director of the Urban Sustainability and Equity Planning Program at the Earth Institute’s Center for Sustainable Urban Development. “If there is not a market for the recycled material, then the numbers do not work for these facilities as well as cities, as they need to sell the materials to recoup their costs of collection and transportation, and even then it’s typically only a portion of the costs,” Columbia’s State of the Planet reported.
Tiffany Duong is an avid ocean advocate. She holds degrees from UCLA and the University of Pennsylvania Carey Law School and is an Al Gore Climate Reality Leader and student member of The Explorer’s Club.
She spent years as a renewable energy lawyer in L.A. before moving to the Amazon to conduct conservation fieldwork (and revamp her life). She eventually landed in the Florida Keys as a scientific scuba diver and field reporter and writes about the oceans, climate, and the environment from her slice of paradise. Follow her on Twitter/Instagram @lilicedt.
- U.S. Leads the World in Plastic Waste, New Study Finds - EcoWatch
- U.S. Products Labeled Recyclable Really Aren't, Greenpeace ...
- John Oliver Takes on the Plastics Industry - EcoWatch
- The Myth About Recycling Plastic? It Works - EcoWatch
- Recycling in the U.S. Is Failing, But These 7 Cities Are Doing Things Right
- Starbucks Pilots Reusable Cups in Seattle, But Does the New Program Go Far Enough?
- Mattel Wants to Recycle Old Barbie Dolls
- Can We Fix Recycling? Some Companies Are Trying
- California Just Passed 5 Mega Laws to Fight the Plastic Crisis - EcoWatch
- U.S. Is World’s Biggest Producer of Plastic Waste, Report Finds - EcoWatch