
 568k
568k  233k
233k  41k
41k  Subscribe
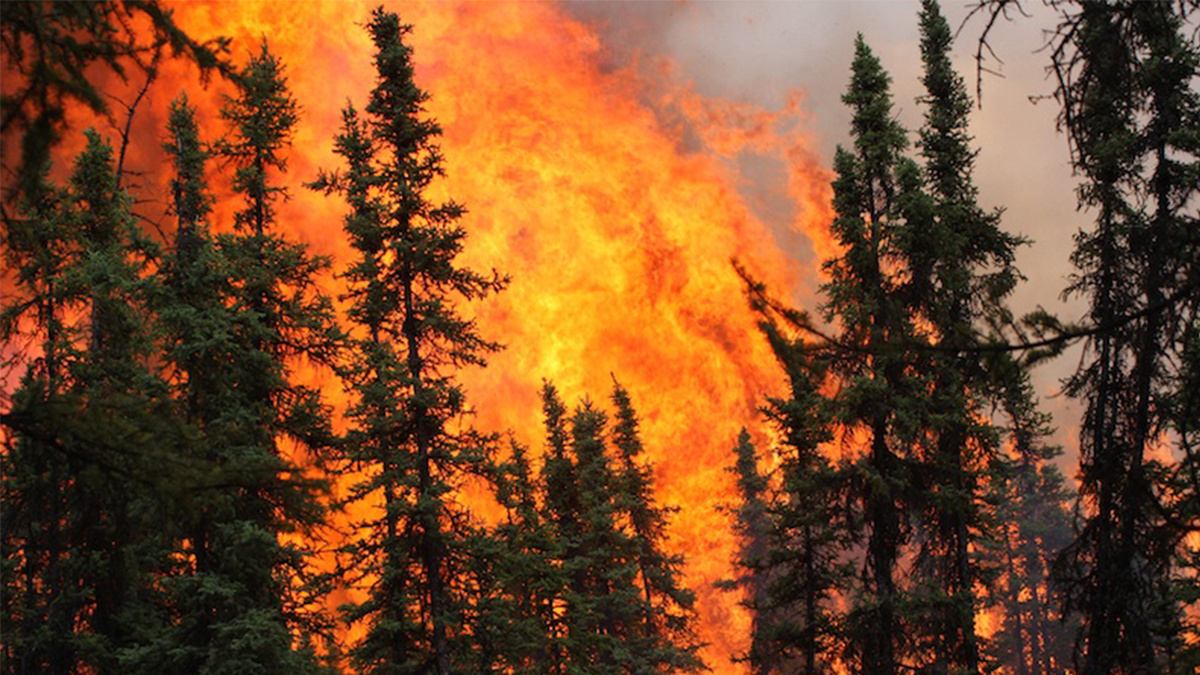
Alaskan boreal forest. Scott Rupp, University of Alaska Fairbanks
From the Amazon to the last frontier of Alaska, fire season is raging on both sides of the equator and bringing with the flames long-term effects that could permanently alter the diverse ecosystems of both regions.
As of Tuesday, the Alaska Interagency Coordination Center reports that more than 200 individual wildfires are burning across the state and threatening more than a thousand structures and forcing hundreds of Alaskans from their homes, reports CNN. In response, Governor Michael Dunleavy issued a disaster declaration for two regions due to three fires — the McKinley, Deshka Landing and Swan Lake wildfires, according to The Hill. In all, TIME reports around 2.5 million acres burned across the state with at least 84 homes and businesses destroyed, according to ABC News.
Now, a new study from the Berkeley Lab finds that future summers characterized by similar record high temperatures and extreme wildfires fueled by climate change could cause the irreparable changes within the forest, pushing cold-preferring iconic evergreen conifer trees out as broadleaf deciduous trees move in.
“Expansion of the deciduous broadleaf forests in a warmer climate may result in several ecological and climatic feedbacks that affect the carbon cycle of northern ecosystems,” said study author and Berkeley Lab postdoctoral fellow Zelalem Mekonnen.

Berkeley Lab scientists Zelalem Mekonnen (left) and William Riley co-authored a study on how wildfires will affect forests in Alaska.
Marilyn Chung / Berkeley Lab
Publishing their work in Nature Plants, a team of researchers from universities across North America used predictive modeling of climate conditions and systems to determine how a warming climate will affect forest systems in higher latitudes. They found that by the end of the century, evergreen conifer trees like the black spruce will drop by up to 25 percent while herbaceous plants like moss and lichen will decline up to 66 percent. Deciduous trees like aspens will almost double in population, dominating the transformed landscape.
The effects of climate change are disproportionately felt in climates of northern latitudes due to a phenomenon known as Arctic amplification, a process that NASA Earth Observatory describes as causing temperatures to rise in the Arctic at faster rates than the global average due to the loss of sea ice giving way to darker ocean waters that absorb more heat. In Alaska, these changes will have impacts that reverberate through the ecosystem. Deciduous trees lose their leaves every year, which means more organic matter may accumulate on the forest floor and create transpiration, a factor that contributes to climate change. Furthermore, large-leafed trees have greater surface reflection and create large canopy covers that may decrease prime habitat for important moss that sustains many wildlife populations.
Then again, deciduous trees are less flammable than evergreens. However, what these changes mean for wildfires is less certain. Models of four different scenarios found that wildfires could increase up to 150 percent — but how they will impact an ecosystem remains unknown. What is for certain is that the forest will remain a net sink for carbon, absorbing more carbon than it emits — but just how much is where the work remains.
“Will it be more or less of a sink? Our next study will quantify the carbon and surface energy budgets,” said Riley.
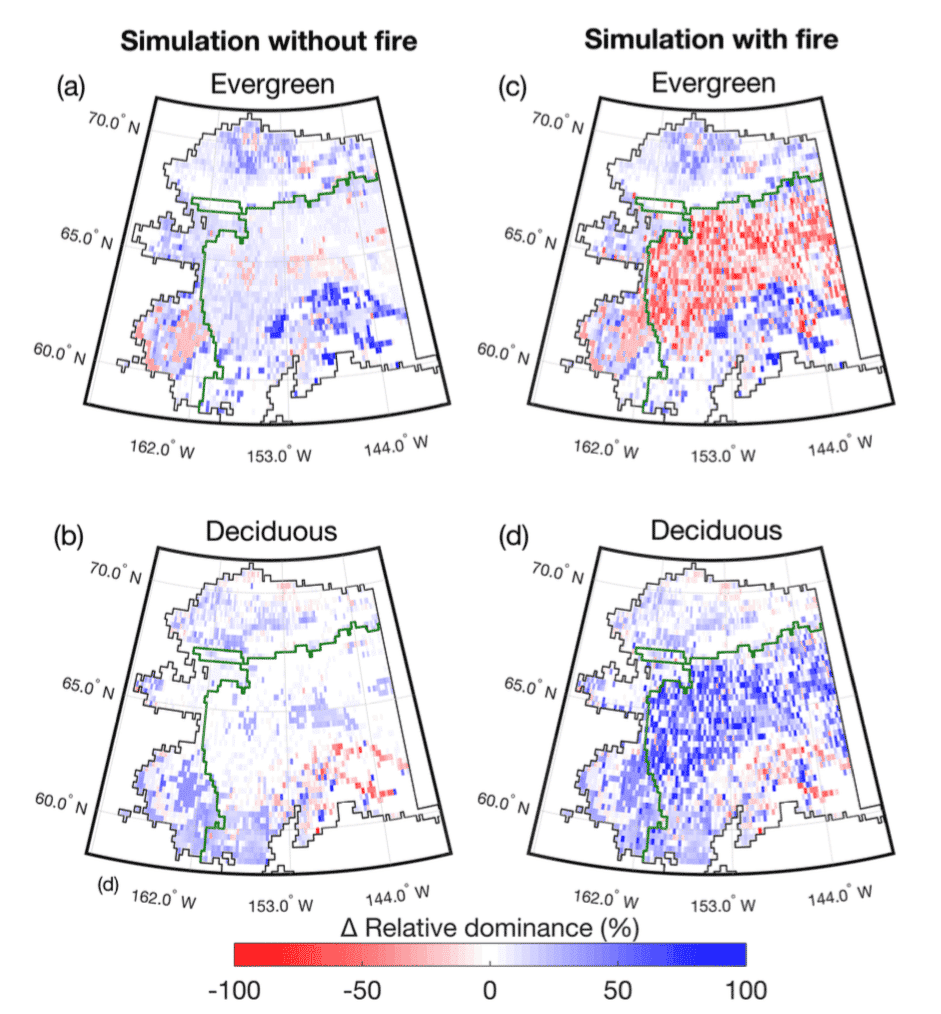
Deciduous broadleaf trees increase, and evergreen conifer trees decrease in interior Alaska between now and 2100 because of warming and wildfire in the boreal forest.
Berkeley Lab