
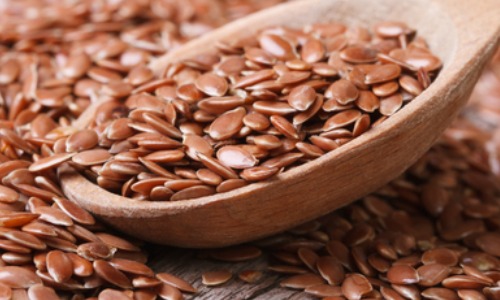
Flaxseeds are a powerhouse of alpha-linolenic acid, or ALA, the plant-based source of omega-3 fat.
Omega-3 fat is essential to a child’s diet—it not only acts as an antioxidant to prevent disease, but it is used by the body to promote healthy cell growth and brain function. Parents may want to use ground flaxseeds (the seeds can be purchased already ground up) since they are better absorbed in that form.
Of course, no child is likely to happily gobble up a spoonful of plain flaxseeds. Sneaking flaxseeds into meals provides a simple solution to getting children to eat them.
Sprinkle in Sandwiches
Sprinkling ground flaxseeds into sandwiches will surely disguise them, especially for visually picky eaters. Flaxseeds can be easily hidden below ketchup, mustard, mayonnaise, peanut butter or jelly. In terms of how much to use, ¼ of a teaspoon will add 400 mg of omega-3 fat to your child’s meal with a flavor that should be masked by condiments, jellies and butters.
Add to Pancakes and Cereal
A pinch of flaxseeds can easily be added to pancake batter, hot cereal such as oatmeal and even cold cereal like corn flakes served with milk. The flaxseeds may be visible and do float in milk. They may also add a slightly nutty flavor—you can experiment with different quantities, such as 1/8 of a teaspoon to see how much added taste from the flaxseeds your child will tolerate.
Include in Baking
Including flaxseeds in muffins and cookies add nutritional value to any baked treat. Ground flaxseeds, which have a brown powder-like consistency, may be noticeable once the goodies are baked. Make the experience of adding the seeds fun—let you child sprinkle the seeds into the batter with his or her fingers or with a measuring spoon.
How Much To Give Children Daily
One tablespoon of ground flaxseeds contains about 1.6 grams of plant omega-3 fat, according to the nutritional value database Nutrition Data.com. According to the U.S. Department of Agriculture, the amount of omega-3 your child should be getting daily depends on his or her age. Babies 0-12 months should receive 500 mg per day, children 1-3 years old should get 700 mg a day, while kids 4-8 should consume 700 mg a day. After the age of 8, the daily recommended amount is different for boys and girls, but ranges between 1 gram and 1.6 grams a day. Keep in mind that most plant foods like grains, nuts and fruit contain some, albiet smaller amounts, of omega 3 fat.
YOU MAY ALSO LIKE
3 Alternatives To Cow’s Milk for Kids
Striking Photos Show What Kids Around the World Eat for Lunch
5 Alternatives to Sugar Your Kids Will Love
A rare yellow penguin has been photographed for what is believed to be the first time.
- World-Renowned Photographer Documents Most Remote ... ›
- This Penguin Colony Has Fallen by 77% on Antarctic Islands ... ›
EcoWatch Daily Newsletter
By Stuart Braun
We spend 90% of our time in the buildings where we live and work, shop and conduct business, in the structures that keep us warm in winter and cool in summer.
But immense energy is required to source and manufacture building materials, to power construction sites, to maintain and renew the built environment. In 2019, building operations and construction activities together accounted for 38% of global energy-related CO2 emissions, the highest level ever recorded.
- Could IKEA's New Tiny House Help Fight the Climate Crisis ... ›
- Los Angeles City-Owned Buildings to Go 100% Carbon Free ... ›
- New Jersey Will Be First State to Require Building Permits to ... ›
Trending
By Eric Tate and Christopher Emrich
Disasters stemming from hazards like floods, wildfires, and disease often garner attention because of their extreme conditions and heavy societal impacts. Although the nature of the damage may vary, major disasters are alike in that socially vulnerable populations often experience the worst repercussions. For example, we saw this following Hurricanes Katrina and Harvey, each of which generated widespread physical damage and outsized impacts to low-income and minority survivors.
Mapping Social Vulnerability
<p>Figure 1a is a typical map of social vulnerability across the United States at the census tract level based on the Social Vulnerability Index (SoVI) algorithm of <a href="https://onlinelibrary.wiley.com/doi/abs/10.1111/1540-6237.8402002" target="_blank"><em>Cutter et al.</em></a> [2003]. Spatial representation of the index depicts high social vulnerability regionally in the Southwest, upper Great Plains, eastern Oklahoma, southern Texas, and southern Appalachia, among other places. With such a map, users can focus attention on select places and identify population characteristics associated with elevated vulnerabilities.</p>Fig. 1. (a) Social vulnerability across the United States at the census tract scale is mapped here following the Social Vulnerability Index (SoVI). Red and pink hues indicate high social vulnerability. (b) This bivariate map depicts social vulnerability (blue hues) and annualized per capita hazard losses (pink hues) for U.S. counties from 2010 to 2019.
<p>Many current indexes in the United States and abroad are direct or conceptual offshoots of SoVI, which has been widely replicated [e.g., <a href="https://link.springer.com/article/10.1007/s13753-016-0090-9" target="_blank"><em>de Loyola Hummell et al.</em></a>, 2016]. The U.S. Centers for Disease Control and Prevention (CDC) <a href="https://www.atsdr.cdc.gov/placeandhealth/svi/index.html" target="_blank">has also developed</a> a commonly used social vulnerability index intended to help local officials identify communities that may need support before, during, and after disasters.</p><p>The first modeling and mapping efforts, starting around the mid-2000s, largely focused on describing spatial distributions of social vulnerability at varying geographic scales. Over time, research in this area came to emphasize spatial comparisons between social vulnerability and physical hazards [<a href="https://doi.org/10.1007/s11069-009-9376-1" target="_blank"><em>Wood et al.</em></a>, 2010], modeling population dynamics following disasters [<a href="https://link.springer.com/article/10.1007%2Fs11111-008-0072-y" target="_blank" rel="noopener noreferrer"><em>Myers et al.</em></a>, 2008], and quantifying the robustness of social vulnerability measures [<a href="https://doi.org/10.1007/s11069-012-0152-2" target="_blank" rel="noopener noreferrer"><em>Tate</em></a>, 2012].</p><p>More recent work is beginning to dissolve barriers between social vulnerability and environmental justice scholarship [<a href="https://doi.org/10.2105/AJPH.2018.304846" target="_blank" rel="noopener noreferrer"><em>Chakraborty et al.</em></a>, 2019], which has traditionally focused on root causes of exposure to pollution hazards. Another prominent new research direction involves deeper interrogation of social vulnerability drivers in specific hazard contexts and disaster phases (e.g., before, during, after). Such work has revealed that interactions among drivers are important, but existing case studies are ill suited to guiding development of new indicators [<a href="https://doi.org/10.1016/j.ijdrr.2015.09.013" target="_blank" rel="noopener noreferrer"><em>Rufat et al.</em></a>, 2015].</p><p>Advances in geostatistical analyses have enabled researchers to characterize interactions more accurately among social vulnerability and hazard outcomes. Figure 1b depicts social vulnerability and annualized per capita hazard losses for U.S. counties from 2010 to 2019, facilitating visualization of the spatial coincidence of pre‑event susceptibilities and hazard impacts. Places ranked high in both dimensions may be priority locations for management interventions. Further, such analysis provides invaluable comparisons between places as well as information summarizing state and regional conditions.</p><p>In Figure 2, we take the analysis of interactions a step further, dividing counties into two categories: those experiencing annual per capita losses above or below the national average from 2010 to 2019. The differences among individual race, ethnicity, and poverty variables between the two county groups are small. But expressing race together with poverty (poverty attenuated by race) produces quite different results: Counties with high hazard losses have higher percentages of both impoverished Black populations and impoverished white populations than counties with low hazard losses. These county differences are most pronounced for impoverished Black populations.</p>Fig. 2. Differences in population percentages between counties experiencing annual per capita losses above or below the national average from 2010 to 2019 for individual and compound social vulnerability indicators (race and poverty).
<p>Our current work focuses on social vulnerability to floods using geostatistical modeling and mapping. The research directions are twofold. The first is to develop hazard-specific indicators of social vulnerability to aid in mitigation planning [<a href="https://doi.org/10.1007/s11069-020-04470-2" target="_blank" rel="noopener noreferrer"><em>Tate et al.</em></a>, 2021]. Because natural hazards differ in their innate characteristics (e.g., rate of onset, spatial extent), causal processes (e.g., urbanization, meteorology), and programmatic responses by government, manifestations of social vulnerability vary across hazards.</p><p>The second is to assess the degree to which socially vulnerable populations benefit from the leading disaster recovery programs [<a href="https://doi.org/10.1080/17477891.2019.1675578" target="_blank" rel="noopener noreferrer"><em>Emrich et al.</em></a>, 2020], such as the Federal Emergency Management Agency's (FEMA) <a href="https://www.fema.gov/individual-disaster-assistance" target="_blank" rel="noopener noreferrer">Individual Assistance</a> program and the U.S. Department of Housing and Urban Development's Community Development Block Grant (CDBG) <a href="https://www.hudexchange.info/programs/cdbg-dr/" target="_blank" rel="noopener noreferrer">Disaster Recovery</a> program. Both research directions posit social vulnerability indicators as potential measures of social equity.</p>Social Vulnerability as a Measure of Equity
<p>Given their focus on social marginalization and economic barriers, social vulnerability indicators are attracting growing scientific interest as measures of inequity resulting from disasters. Indeed, social vulnerability and inequity are related concepts. Social vulnerability research explores the differential susceptibilities and capacities of disaster-affected populations, whereas social equity analyses tend to focus on population disparities in the allocation of resources for hazard mitigation and disaster recovery. Interventions with an equity focus emphasize full and equal resource access for all people with unmet disaster needs.</p><p>Yet newer studies of inequity in disaster programs have documented troubling disparities in income, race, and home ownership among those who <a href="https://eos.org/articles/equity-concerns-raised-in-federal-flood-property-buyouts" target="_blank">participate in flood buyout programs</a>, are <a href="https://www.eenews.net/stories/1063477407" target="_blank" rel="noopener noreferrer">eligible for postdisaster loans</a>, receive short-term recovery assistance [<a href="https://doi.org/10.1016/j.ijdrr.2020.102010" target="_blank" rel="noopener noreferrer"><em>Drakes et al.</em></a>, 2021], and have <a href="https://www.texastribune.org/2020/08/25/texas-natural-disasters--mental-health/" target="_blank" rel="noopener noreferrer">access to mental health services</a>. For example, a recent analysis of federal flood buyouts found racial privilege to be infused at multiple program stages and geographic scales, resulting in resources that disproportionately benefit whiter and more urban counties and neighborhoods [<a href="https://doi.org/10.1177/2378023120905439" target="_blank" rel="noopener noreferrer"><em>Elliott et al.</em></a>, 2020].</p><p>Investments in disaster risk reduction are largely prioritized on the basis of hazard modeling, historical impacts, and economic risk. Social equity, meanwhile, has been far less integrated into the considerations of public agencies for hazard and disaster management. But this situation may be beginning to shift. Following the adage of "what gets measured gets managed," social equity metrics are increasingly being inserted into disaster management.</p><p>At the national level, FEMA has <a href="https://www.fema.gov/news-release/20200220/fema-releases-affordability-framework-national-flood-insurance-program" target="_blank">developed options</a> to increase the affordability of flood insurance [Federal Emergency Management Agency, 2018]. At the subnational scale, Puerto Rico has integrated social vulnerability into its CDBG Mitigation Action Plan, expanding its considerations of risk beyond only economic factors. At the local level, Harris County, Texas, has begun using social vulnerability indicators alongside traditional measures of flood risk to introduce equity into the prioritization of flood mitigation projects [<a href="https://www.hcfcd.org/Portals/62/Resilience/Bond-Program/Prioritization-Framework/final_prioritization-framework-report_20190827.pdf?ver=2019-09-19-092535-743" target="_blank" rel="noopener noreferrer"><em>Harris County Flood Control District</em></a>, 2019].</p><p>Unfortunately, many existing measures of disaster equity fall short. They may be unidimensional, using single indicators such as income in places where underlying vulnerability processes suggest that a multidimensional measure like racialized poverty (Figure 2) would be more valid. And criteria presumed to be objective and neutral for determining resource allocation, such as economic loss and cost-benefit ratios, prioritize asset value over social equity. For example, following the <a href="http://www.cedar-rapids.org/discover_cedar_rapids/flood_of_2008/2008_flood_facts.php" target="_blank" rel="noopener noreferrer">2008 flooding</a> in Cedar Rapids, Iowa, cost-benefit criteria supported new flood protections for the city's central business district on the east side of the Cedar River but not for vulnerable populations and workforce housing on the west side.</p><p>Furthermore, many equity measures are aspatial or ahistorical, even though the roots of marginalization may lie in systemic and spatially explicit processes that originated long ago like redlining and urban renewal. More research is thus needed to understand which measures are most suitable for which social equity analyses.</p>Challenges for Disaster Equity Analysis
<p>Across studies that quantify, map, and analyze social vulnerability to natural hazards, modelers have faced recurrent measurement challenges, many of which also apply in measuring disaster equity (Table 1). The first is clearly establishing the purpose of an equity analysis by defining characteristics such as the end user and intended use, the type of hazard, and the disaster stage (i.e., mitigation, response, or recovery). Analyses using generalized indicators like the CDC Social Vulnerability Index may be appropriate for identifying broad areas of concern, whereas more detailed analyses are ideal for high-stakes decisions about budget allocations and project prioritization.</p>Wisconsin will end its controversial wolf hunt early after hunters and trappers killed almost 70 percent of the state's quota in the hunt's first 48 hours.
By Jessica Corbett
Sen. Bernie Sanders on Tuesday was the lone progressive to vote against Tom Vilsack reprising his role as secretary of agriculture, citing concerns that progressive advocacy groups have been raising since even before President Joe Biden officially nominated the former Obama administration appointee.