
 568k
568k  233k
233k  41k
41k  Subscribe
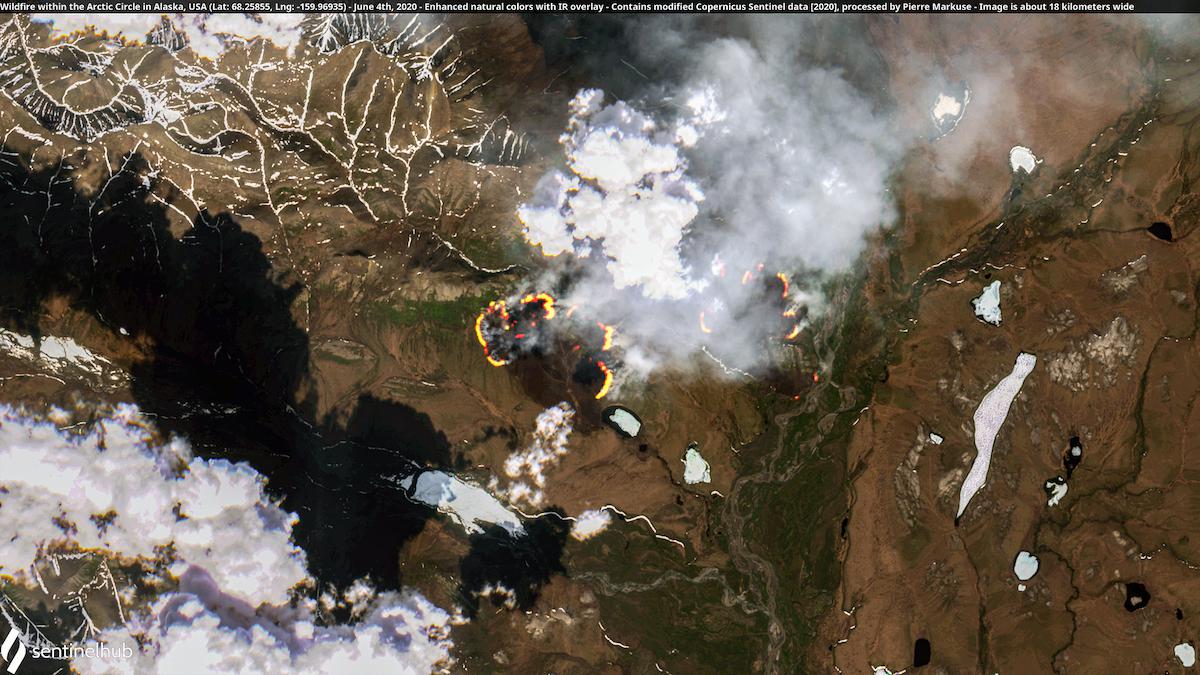
Wildfires within the Arctic Circle in Alaska on June 4, 2020. Contains modified Copernicus Sentinel data processed by Pierre Markuse. CC BY 2.0
By Jeff Masters, Ph.D.
Earth had its second-warmest year on record in 2020, just 0.02 degrees Celsius (0.04°F) behind the record set in 2016, and 0.98 degrees Celsius (1.76°F) above the 20th-century average, NOAA reported January 14.
NASA and the European Copernicus Climate Change Service rated 2020 as tied with 2016 as the warmest year on record (NASA rates the margin of error at .05 degrees C); the Japan Meteorological Agency rated 2020 as the warmest year on record. Minor differences in rankings often occur among various research groups, the result of different ways they handle data-sparse regions such as the Arctic.
Global ocean temperatures in 2020 were the third-warmest on record, global land temperatures the warmest on record. Global satellite-measured temperatures in 2020 for the lowest eight kilometers of the atmosphere were the second-warmest or warmest in the 42-year record, according to the University of Alabama, Huntsville and Remote Sensing Solutions, respectively.
The Northern Hemisphere had its warmest year on record in 2020 and the Southern Hemisphere its fifth-warmest. By continent, here are the 2020 temperature rankings:
Europe: first warmest
Asia: first warmest
South America: second warmest
Africa: fourth warmest
Australia (and Oceania): fourth warmest
North America: 10th warmest
As detailed in a January 12 post at this site by Bob Henson, 2020 for the U.S. was the fifth-warmest year in history going back to 1895. Ten states had their second-warmest year on record and four had their third-warmest year. None of the contiguous 48 states was below-average in temperature in 2020.
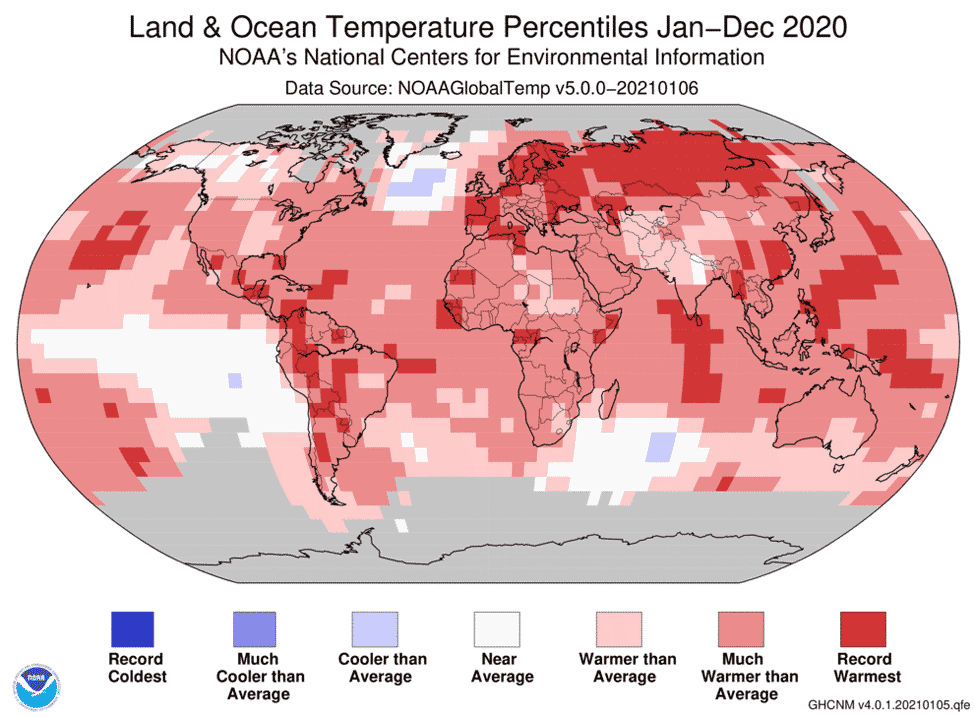
Figure 1. Departure of temperature from average for 2020, the second-warmest year the globe has seen since record-keeping began in 1880, according to NOAA. Record-high annual temperatures over land and ocean surfaces were measured across parts of Europe, Asia, southern North America, South America, and across parts of the Atlantic, Indian, and Pacific oceans. No land or ocean areas were record cold for the year. NOAA National Centers for Environmental Information
The remarkable global warmth of 2020 means that the seven warmest years on record since 1880 were the most recent seven years — 2014 through 2020. The near-record global warmth in 2020 is all the more striking since it occurred during the minimum of the weakest solar cycle in more than 100 years and during a year without a strong El Niño. Record-warm global temperatures typically occur during strong El Niño events and when the solar cycle is near its maximum. The warmth of 2020 is a testament to how significantly human-caused global warming is heating the planet.
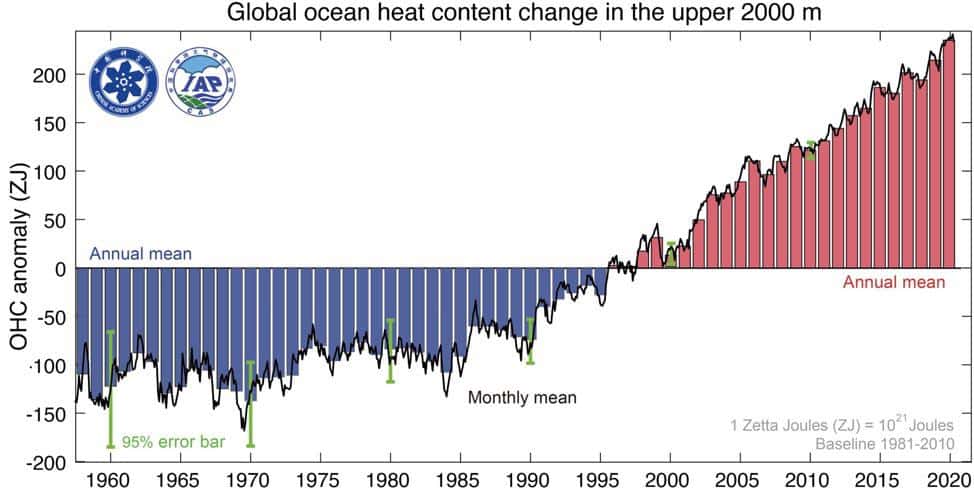
Figure 2. Total ocean heat content (OHC) in the top 2000 meters from 1958-2020. Cheng et al., Upper Ocean Temperatures Hit Record High in 2020, Advances in Atmospheric Sciences
Warmest Year on Record for Total Ocean Heat Content
Despite the presence of a prominent La Niña event that began in August, the total heat content of the world’s oceans in 2020 was the warmest in recorded human history, according to a January 13, 2021 paper by Cheng et al., Upper Ocean Temperatures Hit Record High in 2020, published in Advances in Atmospheric Sciences. In the uppermost 2,000 meters of the oceans, there were 211 to 234 zettajoules more heat in 2020 than the 1981-2010 average, and 2020 had 1 to 20 zettajoules more ocean heat content than in 2019 (a zettajoule is one sextillion joules — ten to the 21st power). For comparison, in 2010, humans used a total of 0.5 zettajoules of energy.
More than 90% of the increasing heat from human-caused global warming accumulates in the ocean because of its large heat capacity. The remaining heating manifests as atmospheric warming, a drying and warming landmass, and melting land and sea ice. Increasing ocean heat content causes sea-level rise through thermal expansion of the water and melting of glaciers in contact with the ocean. It also produces stronger and more rapidly intensifying hurricanes; causes more intense precipitation events that can lead to destructive flooding; contributes to “marine heat waves” that damage or destroy coral reefs; and disrupts atmospheric circulation patterns.
A Slew of Heat Records in 2020
International records researcher Maximiliano Herrera keeps the pulse of the planet in remarkable detail, and he logged 11 nations or territories that set or tied their all-time heat records in 2020. That total fell far short of the record of 24 such records in 2019. No nations or territories set or tied an all-time cold record in 2020. Here are the all-time heat records set in 2020:
Colombia: 42.6°C (108.7°F) at Jerusalem, February 19 (tie);
Ghana: 44.0°C (111.2°F) at Navrongo, April 6;
Cuba: 39.2°C (102.6°F) at Palo Seco, April 10; broken again April 11 with 39.3°C (102.7°F) at Veguitas, and again on April 12 with 39.7°C (103.5°F) at Veguitas;
Mayotte, France department: 36.4°C (97.5°F) at Trevani, April 14;
Taiwan: 40.5°C (104.9°F) at Taimali Research Center, July 16;
Lebanon: 45.4°C (113.7°F) at Houche Al Oumara, July 27;
United States: 54.4°C (129.9°F) at Death Valley, California, August 16;
Japan: 41.1°C (106.0°F) at Hamamatsu, August 17;
Dominica: 35.7°C (96.3°F) at Canefield Airport, September 15;
Puerto Rico (U.S. territory): 37.8°C (100.0°F ) at Aguirre, September 17; and
Paraguay: 45.5°C (113.9°F ) at Pozo Hondo, September 26.
Among global weather stations having at least 40 years of record-keeping, Herrera documented 348 that exceeded their all-time heat record in 2020; only eight stations with a long-term period of record set an all-time cold record in 2020. For comparison, 632 stations set their all-time heat record in 2019 and 11 their all-time cold record.
Notable Global Heat and Cold Records for 2020
Hottest temperature in the Northern Hemisphere: 54.4°C (129.9°F) at Death Valley, U.S., August 16;
Coldest temperature in the Northern Hemisphere: -66.0°C (-86.8°F) at Summit, Greenland, January 2;
Hottest temperature in the Southern Hemisphere: 48.9°C (120.0°F) at Penrith Lakes, Australia, January 4;
Coldest temperature in the Southern Hemisphere: -80.8°C (-113.4°F) at Dome Fuji, Antarctica, August 16;
Highest 2020 average temperature worldwide: 31.5°C (88.7°F) at Yelimane, Mali, and Matam, Senegal; and
Highest 2020 average temperature in the Southern Hemisphere: 29.8°C (85.6°F) at Surabaya Airport, Indonesia, and Wyndham, Australia.
Earth’s record for hottest yearly average temperature was 32.9°C (91.2°F) at Makkah, Saudi Arabia, in 2010 and 2016.
126 Additional Monthly National/Territorial Heat Records Beaten or Tied
In addition to the 11 all-time national heat records, 126 other national monthly heat records were set in 2020, for a total of 137 national monthly heat records:
– January (13): Norway, South Korea, Angola, Congo Brazzaville, Dominica, Mexico, Indonesia, Guinea Bissau, Gambia, Sao Tome and Principe, Cuba, British Indian Ocean Territory, Singapore;
– February (12): Spain, Antarctica, Azerbaijan, Costa Rica, The Bahamas, Switzerland, Maldives, Gambia, Russia, Seychelles, Dominican Republic, U.S. Virgin Islands;
– March (7): Paraguay, Cabo Verde, Mozambique, Seychelles, United States, Thailand, Northern Mariana Islands;
– April (14): Paraguay, Niger, St. Barthelemy, Honduras, Guernsey, Haiti, Congo Brazzaville, Kyrgyzstan, Mongolia, China, Saba, Northern Mariana Islands, U.S. Virgin Islands, Dominican Republic;
– May (10): Niger, Greece, Saba, Cyprus, Solomon Islands, Turkey, Haiti, Kazakhstan, Chile, Uzbekistan;
– June (6): Maldives, Thailand, U.S. Virgin Islands, Saba, Kenya, Ghana;
– July (7): Mozambique, U.S. Virgin Islands, Laos, Myanmar, Iran, Saudi Arabia, Northern Mariana Islands;
– August (6): Solomon Islands, Mexico, Australia, Cocos Islands, Paraguay, U.S. Virgin Islands;
– September (18): Laos, Taiwan, Japan, Turkey, Lebanon, Israel, Jordan, Cyprus, Mexico, Belgium, Netherlands, Luxembourg, Botswana, St. Barthelemy, Mayotte, Argentina, Brazil, British Indian Ocean Territory;
– October (11): Algeria, Brazil, Tunisia, Turkey, Cyprus, Jordan, Peru, Myanmar, Northern Marianas Islands, Botswana, Maldives;
– November (11): Luxembourg, Finland, Nepal, Mexico, Aland Islands, Sweden, Maldives, Northern Marianas, Taiwan, Swaziland, Sudan; and
– December (11): Mexico, Ghana, Pakistan, Algeria, Qatar, Maldives, Niger, Taiwan, Dominica, Falkland Islands, South Georgia and the Sandwich Islands.
One Monthly National/Territorial Cold Record Beaten or Tied in 2020
– April: St. Eustatius.
An October monthly record reported in Aruba was judged to be unreliable.
Hemispherical and Continental Temperature Records in 2020
– Highest minimum temperature ever recorded in the Northern Hemisphere in January: 29.1°C (84.4°F) at Bonriki, Kiribati, January 17;
– Highest maximum temperature ever recorded in North America in January: 42.0°C (107.6°F) at Vicente Guerrero, Mexico, January 21;
– Highest temperature ever recorded in continental Antarctica and highest February temperature ever recorded in Antarctica plus the surrounding islands: 18.4°C (65.1°F) at Base Esperanza, February 6;
– Highest minimum temperature ever recorded in February in Antarctica: 7.6°C (45.7°F) at Base Marambio, February 9;
– Highest minimum temperature ever recorded in February in the Northern Hemisphere: 32.0°C (89.6°F) at Yelimane, Mali, February 23;
– Highest minimum temperature ever recorded in April in the Southern Hemisphere: 31.1°C (88.0°F) at Argyle, Australia, April 2;
– Highest minimum temperature ever recorded in May in Europe: 30.1°C (86.2°F) at Emponas, Greece, May 17;
– Highest minimum temperature ever recorded in May in North America: 35.0°C (95.0°F) at Death Valley, California (U.S.), May 28;
– Highest temperature ever recorded in the polar regions: 38.0°C (100.4°F) at Verkhoyansk, Russia, June 20;
– Highest reliable temperature ever recorded on Earth: 54.4°C (129.9°F) at Death Valley, California, August 16;
– Highest reliable minimum temperature ever recorded in August in North America: 40.0°C (104.0°F) at Death Valley, California (U.S.), August 17;
– Highest temperature ever recorded in Australia and Oceana in August: 40.7°C (105.3°F) at Yampi Sound, Australia, August 22; beaten again with 41.2°C (106.2°F) at West Roebuck, Australia, on August 23; and
– Highest temperature ever recorded in the Northern Hemisphere in November: 44.8°C (112.6°F) at San Francisco and Tubares, Mexico, November 5.
December 2020: Earth’s Eighth-Warmest December on Record
December 2020 was the eighth-warmest December since global record-keeping began in 1880, NOAA’s National Centers for Environmental Information reported January 14. NASA and the European Copernicus Climate Change Service rated the month as the sixth-warmest December on record, and the Japan Meteorological Agency rated it as the tenth-warmest. Again: Minor differences in rankings often occur among various research groups, the result of different ways they handle data-sparse regions such as the Arctic.
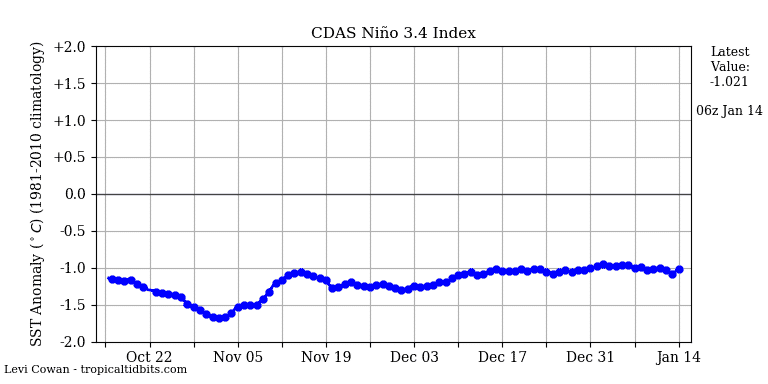
Figure 3. Departure of sea surface temperature from average in the benchmark Niño 3.4 region of the eastern tropical Pacific (5°N-5°S, 170°W-120°W). Sea surface temperature were approximately one degree Celsius below average over the past month, characteristic of moderate La Niña conditions. Tropical Tidbits
A Moderate La Niña Event Continues
La Niña conditions remained in the moderate range during December and early January, prompting NOAA to continue its La Niña advisory in a January 14 monthly discussion of the state of the El Niño/Southern Oscillation, or ENSO.
Over the past month, sea surface temperatures in the benchmark Niño 3.4 region of the eastern tropical Pacific (5°N-5°S, 170°W-120°W) have been approximately 1 degree Celsius below average. The threshold for “strong” La Niña conditions is 1.5 degrees Celsius below average; “moderate” La Niña conditions are 1.0-1.5 degrees below average.
Forecasters at NOAA and at Columbia University’s International Research Institute for Climate and Society expect La Niña conditions will continue through the winter (95% chance during January-February-March), and potentially transition to “neutral” during the spring (55% chance during April-May-June). About half of all La Niña events continue into a second year, but fewer than 20% of the ENSO models predicted that La Niña conditions would last into the summer of 2021.
Arctic Sea Ice: Third-Lowest December Extent on Record
Arctic sea ice extent during December 2020 was the third-lowest in the 42-year satellite record, behind 2016 and 2017, according to the National Snow and Ice Data Center. Antarctic sea ice extent in December 2020 was near-average.
Notable Global Heat and Cold Marks for December 2020
– Hottest temperature in the Northern Hemisphere: 41.5°C (106.7°F) at Matam, Senegal, December 2;
– Coldest temperature in the Northern Hemisphere: -57.5°C (-71.5°F) at Oymykon, Russia, December 29;
– Hottest temperature in the Southern Hemisphere: 48.7°C (119.7°F) at Birdsville, Australia, December 5; and
– Coldest temperature in the Southern Hemisphere: -44.9°C (-48.8°F) at Dome A, Antarctica, December 3.
Major Weather Stations’ New All-Time Heat or Cold Records in December 2020
Among global stations with a record of at least 40 years, two stations set all-time cold records in December, and no stations set an all-time heat record:
Hamamasu (Japan) min. -21.5°C (-6.7°F), December 31; and
Bibai (Japan) min. -26.5°C (-15.7°F), December 31.
Statistics courtesy of Maximiliano Herrera.
Reposted with permission from Yale Climate Connections.
- NASA and NOAA: Last Decade Was the Hottest on Record - EcoWatch
- Earth Just Had Its Hottest September Ever Recorded, NOAA Says ...
- North America Just Experienced Its Hottest June on Record
- Sicily Reports Hottest Temperature Ever Recorded in Europe as Wildfires Scorch Mediterranean
- Summer of 2021 Was the Hottest Summer on Record: NOAA