
Iron is a mineral that serves several important functions in the body. Its main function is carrying oxygen throughout your body and making red blood cells (1).
Iron is an essential nutrient, meaning you must get it from food. The recommended daily intake (RDI) is 18 mg. Interestingly, the amount your body absorbs is partly based on how much you have stored.
A deficiency can occur if your intake is too low to replace the amount you lose every day (2).
Iron deficiency can cause anemia and lead to symptoms like fatigue. Menstruating women who don't consume iron-rich foods are at particularly high risk of deficiency.
Here are 11 healthy foods that are high in iron.
1. Shellfish
Shellfish is tasty and nutritious. All shellfish is high in iron, but clams, oysters and mussels are particularly good sources.
For instance, a 3.5-ounce (100-gram) serving of clams contains 28 mg of iron, which is 155 percent of the RDI (3).
What's more, a lot of the iron in shellfish is heme iron, which your body absorbs more easily than the non-heme iron found in plants (4).
A serving of clams also provides 26 grams of protein, 37 percent of the RDI for vitamin C and a whopping 1,648 percent of the RDI for vitamin B12.
In fact, all shellfish is high in nutrients. Shellfish has also been shown to increase the level of heart-healthy HDL cholesterol in your blood (5).
Although there are legitimate concerns about mercury and toxins in certain types of fish and shellfish, the benefits of consuming seafood far outweigh the risks (6).
Bottom Line: A 100-gram serving of clams provides 155 percent of the RDI for iron. Shellfish is also rich many other nutrients.
2. Spinach
Spinach provides many health benefits for very few calories.
3.5 ounces (100 grams) of cooked spinach contain 3.6 mg of iron or 20 percent of the RDI (7).
Although this is non-heme iron, which isn't absorbed very well, spinach is also rich in vitamin C.
This is important, since vitamin C significantly boosts iron absorption (8).
Spinach is also rich in antioxidants called carotenoids that may reduce the risk of cancer, decrease inflammation and protect your eyes from disease (9, 10, 11, 12).
Consuming spinach and other leafy greens with fat helps your body absorb the carotenoids, so make sure to eat a healthy fat like olive oil with your spinach (13).
Bottom Line: Spinach provides 20 percent of the RDI for iron per serving, along with several vitamins and minerals. It also contains important antioxidants.
3. Liver and Other Organ Meats
Organ meats are extremely nutritious. Popular types include liver, kidneys, brain and heart. All of these are high in iron.
For example, a 3.5-ounce (100-gram) serving of beef liver contains 6.5 mg of iron or 36 percent of the RDI (14).
Organ meats are high in protein and rich in B-vitamins, copper and selenium. Liver is especially high in vitamin A, providing an impressive 634 percent of the RDI per serving.
Organ meats are also among the best sources of choline, an important nutrient for brain and liver health that many people don't get enough of (15).
Bottom Line: Organ meats are good sources of iron and liver contains 36 percent of the RDI per serving. Organ meats are also rich in many other nutrients.
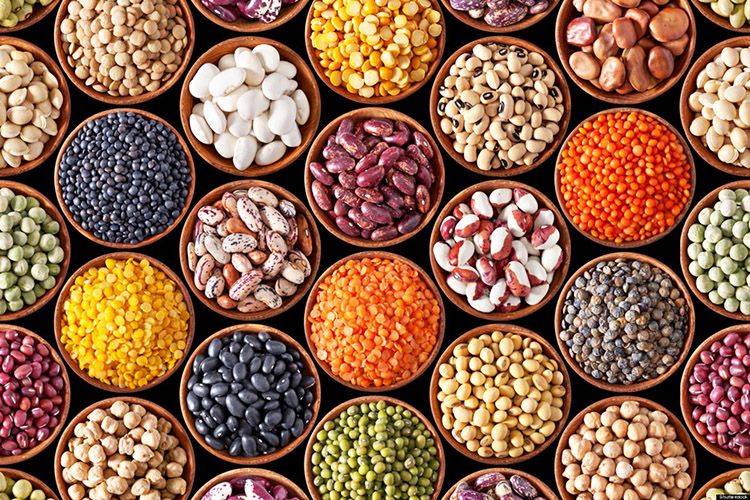
4. Legumes
Legumes are loaded with nutrients.
Some of the most common types of legumes are beans, lentils, chickpeas, peas and soybeans.
They're a great source of iron, especially for vegetarians. One cup (198 grams) of cooked lentils contains 6.6 mg, which is 37 percent of the RDI (16).
Legumes are also rich in folate, magnesium and potassium.
What's more, studies have shown that beans and other legumes can reduce inflammation in people with diabetes. Legumes can also decrease heart disease risk for people with metabolic syndrome (17, 18, 19, 20).
Additionally, legumes may help you lose weight. They're very high in soluble fiber, which can increase feelings of fullness and reduce calorie intake (21).
In one study, a high-fiber diet containing beans was shown to be as effective as a low-carb diet for weight loss (22).
In order to maximize iron absorption, consume legumes with foods high in vitamin C, such as tomatoes, greens or citrus fruits.
Bottom Line: One cup of cooked lentils provides 37 percent of the RDI for iron. Legumes are also high in folate, magnesium, potassium and fiber.
5. Red Meat
Red meat is satisfying and nutritious. A 3.5-ounce (100-gram) serving of ground beef contains 2.7 mg of iron, which is 15 percent of the RDI (23).
Meat is also rich in protein, zinc, selenium and several B-vitamins (24).
Researchers have suggested that iron deficiency may be less likely in people who eat meat, poultry and fish on a regular basis (25).
In fact, red meat is probably the single most easily accessible source of heme iron, potentially making it an important food for people who are prone to anemia.
In one study looking at changes in iron stores after aerobic exercise, women who consumed meat retained iron better than those who took iron supplements (26).
Bottom Line: One serving of ground beef contains 15 percent of the RDI for iron and is one of the most easily accessible sources of heme iron. It's also rich in B vitamins, zinc, selenium and high-quality protein.
6. Pumpkin Seeds
Pumpkin seeds are a tasty, portable snack.
A 1-ounce (28-gram) serving of pumpkin seeds contains 4.2 mg of iron, which is 23 percent of the RDI (27).
In addition, pumpkin seeds are a good source of vitamin K, zinc and manganese. They're also among the best sources of magnesium, which many people are deficient in (28).
A 28-gram serving contains 37 percent of the RDI for magnesium, which helps reduce the risk of insulin resistance, diabetes and depression (29, 30, 31).
Bottom Line: Pumpkin seeds provide 26 percent of the RDI for iron per serving. They are also a good source of several other nutrients and an excellent source of magnesium.
7. Quinoa
Quinoa is a popular grain known as a pseudocereal. One cup (185 grams) of cooked quinoa provides 2.8 mg of iron, which is 15 percent of the RDI (32).
Furthermore, quinoa contains no gluten, making it a good choice for people with celiac disease or other forms of gluten intolerance.
Quinoa is also higher in protein than many other grains, as well as rich in folate, magnesium, copper, manganese and many other nutrients.
In addition, quinoa has more antioxidant activity than other grains. Antioxidants help protect your cells from the damage done by free radicals, which are formed during metabolism and in response to stress (33, 34).
Bottom Line: Quinoa provides 15 percent of the RDI for iron per serving. It also contains no gluten and is high in protein, folate, minerals and antioxidants.
8. Turkey
Turkey meat is a healthy and delicious food. It's also a good source of iron—especially dark turkey meat.
A 3.5-ounce (100-gram) portion of dark turkey meat has 2.3 mg of iron, which is 13 percent of the RDI (35).
In comparison, the same amount of white turkey meat contains only 1.3 mg (36).
Turkey also contains several B-vitamins and minerals, including 30 percent of the RDI for zinc and 58 percent of the RDI for selenium.
In addition, turkey contains an impressive 29 grams of protein per serving.
Consuming high-protein foods like turkey may help with weight loss, because protein makes you feel full and increases your metabolic rate after a meal (37, 38, 39).
High protein intake can also help prevent the muscle loss that occurs during weight loss and as part of the aging process (40, 41).
Bottom Line: Turkey provides 13 percent of the RDI for iron and is a good source of several vitamins and minerals. Its high protein content promotes fullness, increases metabolism and prevents muscle loss.
9. Broccoli
Broccoli is incredibly nutritious. A 1-cup (156-gram) serving of cooked broccoli contains 1 mg of iron, which is 6 percent of the RDI. This makes it a fairly good source (42).
What's more, a serving of broccoli also contains 168 percent of the RDI for vitamin C, which helps your body absorb the iron better (8, 43).
In addition, this serving of broccoli is high in folate and provides 6 grams of fiber. It also contains vitamin K.
Broccoli is a member of the cruciferous vegetable family, which also includes cauliflower, Brussels sprouts, kale and cabbage.
Cruciferous vegetables contain indole, sulforaphane and glucosinolates, which are plant compounds believed to be protective against cancer (44, 45, 46, 47).
Bottom Line: One serving of broccoli provides 6 percent of the RDI for iron and is very high in vitamins C, K and folate. It may also help reduce cancer risk.
10. Tofu
Tofu is a soy-based food that's popular among vegetarians and in some Asian countries.
A half-cup (126-gram) serving provides 3.6 mg of iron, which is 19 percent of the RDI (48).
Tofu is also a good source of thiamin and several minerals, including calcium, magnesium and selenium. In addition, it provides 20 grams of protein per serving.
Tofu also contains unique compounds called isoflavones, which have been linked to improved insulin sensitivity, a decreased risk of heart disease and relief from menopausal symptoms (49, 50).
Bottom Line: Tofu provides 19 percent of the RDI for iron per serving and is rich in protein and minerals. The isoflavones in it may improve heart health and relieve menopausal symptoms.
11. Dark Chocolate
Dark chocolate is incredibly delicious and nutritious.
A 1-ounce (28-gram) serving contains 3.3 mg of iron, which is 19 percent of the RDI (51).
This small serving also provides 25 percent of the RDI for copper and 16 percent of the RDI for magnesium.
In addition, it contains prebiotic fiber, which nourishes the friendly bacteria in your gut (52).
A study found that cocoa powder and dark chocolate had more antioxidant activity than powders and juices made from acai berries and blueberries (53).
Studies have also shown that chocolate has beneficial effects on cholesterol and may reduce your risk of heart attacks and strokes (54, 55, 56).
However, not all chocolate is created equal. It's believed that compounds called flavanols are responsible for chocolate's benefits and the flavanol content of dark chocolate is much higher than that of milk chocolate (57).
Therefore, it's best to consume chocolate with a minimum of 70 percent cocoa to get the maximum benefits.
Bottom Line: A small serving of dark chocolate contains 19 percent of the RDI for iron, along with several minerals and prebiotic fiber that promotes gut health.
Iron is Incredibly Important
Iron is an important mineral that must be consumed regularly.
Yet it should be noted that some people need to limit their intake of red meat and other foods high in heme iron.
However, most people are easily able to regulate the amount they absorb from food.
Remember that if you don't eat meat or fish, you can boost absorption by including a source of vitamin C when eating plant sources of iron.
This article was reposted from our media associate Authority Nutrition.
YOU MIGHT ALSO LIKE
These 10 Superfoods Can Help Balance Your Hormones and Reduce Inflammation
A rare yellow penguin has been photographed for what is believed to be the first time.
- World-Renowned Photographer Documents Most Remote ... ›
- This Penguin Colony Has Fallen by 77% on Antarctic Islands ... ›
EcoWatch Daily Newsletter
By Stuart Braun
We spend 90% of our time in the buildings where we live and work, shop and conduct business, in the structures that keep us warm in winter and cool in summer.
But immense energy is required to source and manufacture building materials, to power construction sites, to maintain and renew the built environment. In 2019, building operations and construction activities together accounted for 38% of global energy-related CO2 emissions, the highest level ever recorded.
- Could IKEA's New Tiny House Help Fight the Climate Crisis ... ›
- Los Angeles City-Owned Buildings to Go 100% Carbon Free ... ›
- New Jersey Will Be First State to Require Building Permits to ... ›
Trending
By Eric Tate and Christopher Emrich
Disasters stemming from hazards like floods, wildfires, and disease often garner attention because of their extreme conditions and heavy societal impacts. Although the nature of the damage may vary, major disasters are alike in that socially vulnerable populations often experience the worst repercussions. For example, we saw this following Hurricanes Katrina and Harvey, each of which generated widespread physical damage and outsized impacts to low-income and minority survivors.
Mapping Social Vulnerability
<p>Figure 1a is a typical map of social vulnerability across the United States at the census tract level based on the Social Vulnerability Index (SoVI) algorithm of <a href="https://onlinelibrary.wiley.com/doi/abs/10.1111/1540-6237.8402002" target="_blank"><em>Cutter et al.</em></a> [2003]. Spatial representation of the index depicts high social vulnerability regionally in the Southwest, upper Great Plains, eastern Oklahoma, southern Texas, and southern Appalachia, among other places. With such a map, users can focus attention on select places and identify population characteristics associated with elevated vulnerabilities.</p>Fig. 1. (a) Social vulnerability across the United States at the census tract scale is mapped here following the Social Vulnerability Index (SoVI). Red and pink hues indicate high social vulnerability. (b) This bivariate map depicts social vulnerability (blue hues) and annualized per capita hazard losses (pink hues) for U.S. counties from 2010 to 2019.
<p>Many current indexes in the United States and abroad are direct or conceptual offshoots of SoVI, which has been widely replicated [e.g., <a href="https://link.springer.com/article/10.1007/s13753-016-0090-9" target="_blank"><em>de Loyola Hummell et al.</em></a>, 2016]. The U.S. Centers for Disease Control and Prevention (CDC) <a href="https://www.atsdr.cdc.gov/placeandhealth/svi/index.html" target="_blank">has also developed</a> a commonly used social vulnerability index intended to help local officials identify communities that may need support before, during, and after disasters.</p><p>The first modeling and mapping efforts, starting around the mid-2000s, largely focused on describing spatial distributions of social vulnerability at varying geographic scales. Over time, research in this area came to emphasize spatial comparisons between social vulnerability and physical hazards [<a href="https://doi.org/10.1007/s11069-009-9376-1" target="_blank"><em>Wood et al.</em></a>, 2010], modeling population dynamics following disasters [<a href="https://link.springer.com/article/10.1007%2Fs11111-008-0072-y" target="_blank" rel="noopener noreferrer"><em>Myers et al.</em></a>, 2008], and quantifying the robustness of social vulnerability measures [<a href="https://doi.org/10.1007/s11069-012-0152-2" target="_blank" rel="noopener noreferrer"><em>Tate</em></a>, 2012].</p><p>More recent work is beginning to dissolve barriers between social vulnerability and environmental justice scholarship [<a href="https://doi.org/10.2105/AJPH.2018.304846" target="_blank" rel="noopener noreferrer"><em>Chakraborty et al.</em></a>, 2019], which has traditionally focused on root causes of exposure to pollution hazards. Another prominent new research direction involves deeper interrogation of social vulnerability drivers in specific hazard contexts and disaster phases (e.g., before, during, after). Such work has revealed that interactions among drivers are important, but existing case studies are ill suited to guiding development of new indicators [<a href="https://doi.org/10.1016/j.ijdrr.2015.09.013" target="_blank" rel="noopener noreferrer"><em>Rufat et al.</em></a>, 2015].</p><p>Advances in geostatistical analyses have enabled researchers to characterize interactions more accurately among social vulnerability and hazard outcomes. Figure 1b depicts social vulnerability and annualized per capita hazard losses for U.S. counties from 2010 to 2019, facilitating visualization of the spatial coincidence of pre‑event susceptibilities and hazard impacts. Places ranked high in both dimensions may be priority locations for management interventions. Further, such analysis provides invaluable comparisons between places as well as information summarizing state and regional conditions.</p><p>In Figure 2, we take the analysis of interactions a step further, dividing counties into two categories: those experiencing annual per capita losses above or below the national average from 2010 to 2019. The differences among individual race, ethnicity, and poverty variables between the two county groups are small. But expressing race together with poverty (poverty attenuated by race) produces quite different results: Counties with high hazard losses have higher percentages of both impoverished Black populations and impoverished white populations than counties with low hazard losses. These county differences are most pronounced for impoverished Black populations.</p>Fig. 2. Differences in population percentages between counties experiencing annual per capita losses above or below the national average from 2010 to 2019 for individual and compound social vulnerability indicators (race and poverty).
<p>Our current work focuses on social vulnerability to floods using geostatistical modeling and mapping. The research directions are twofold. The first is to develop hazard-specific indicators of social vulnerability to aid in mitigation planning [<a href="https://doi.org/10.1007/s11069-020-04470-2" target="_blank" rel="noopener noreferrer"><em>Tate et al.</em></a>, 2021]. Because natural hazards differ in their innate characteristics (e.g., rate of onset, spatial extent), causal processes (e.g., urbanization, meteorology), and programmatic responses by government, manifestations of social vulnerability vary across hazards.</p><p>The second is to assess the degree to which socially vulnerable populations benefit from the leading disaster recovery programs [<a href="https://doi.org/10.1080/17477891.2019.1675578" target="_blank" rel="noopener noreferrer"><em>Emrich et al.</em></a>, 2020], such as the Federal Emergency Management Agency's (FEMA) <a href="https://www.fema.gov/individual-disaster-assistance" target="_blank" rel="noopener noreferrer">Individual Assistance</a> program and the U.S. Department of Housing and Urban Development's Community Development Block Grant (CDBG) <a href="https://www.hudexchange.info/programs/cdbg-dr/" target="_blank" rel="noopener noreferrer">Disaster Recovery</a> program. Both research directions posit social vulnerability indicators as potential measures of social equity.</p>Social Vulnerability as a Measure of Equity
<p>Given their focus on social marginalization and economic barriers, social vulnerability indicators are attracting growing scientific interest as measures of inequity resulting from disasters. Indeed, social vulnerability and inequity are related concepts. Social vulnerability research explores the differential susceptibilities and capacities of disaster-affected populations, whereas social equity analyses tend to focus on population disparities in the allocation of resources for hazard mitigation and disaster recovery. Interventions with an equity focus emphasize full and equal resource access for all people with unmet disaster needs.</p><p>Yet newer studies of inequity in disaster programs have documented troubling disparities in income, race, and home ownership among those who <a href="https://eos.org/articles/equity-concerns-raised-in-federal-flood-property-buyouts" target="_blank">participate in flood buyout programs</a>, are <a href="https://www.eenews.net/stories/1063477407" target="_blank" rel="noopener noreferrer">eligible for postdisaster loans</a>, receive short-term recovery assistance [<a href="https://doi.org/10.1016/j.ijdrr.2020.102010" target="_blank" rel="noopener noreferrer"><em>Drakes et al.</em></a>, 2021], and have <a href="https://www.texastribune.org/2020/08/25/texas-natural-disasters--mental-health/" target="_blank" rel="noopener noreferrer">access to mental health services</a>. For example, a recent analysis of federal flood buyouts found racial privilege to be infused at multiple program stages and geographic scales, resulting in resources that disproportionately benefit whiter and more urban counties and neighborhoods [<a href="https://doi.org/10.1177/2378023120905439" target="_blank" rel="noopener noreferrer"><em>Elliott et al.</em></a>, 2020].</p><p>Investments in disaster risk reduction are largely prioritized on the basis of hazard modeling, historical impacts, and economic risk. Social equity, meanwhile, has been far less integrated into the considerations of public agencies for hazard and disaster management. But this situation may be beginning to shift. Following the adage of "what gets measured gets managed," social equity metrics are increasingly being inserted into disaster management.</p><p>At the national level, FEMA has <a href="https://www.fema.gov/news-release/20200220/fema-releases-affordability-framework-national-flood-insurance-program" target="_blank">developed options</a> to increase the affordability of flood insurance [Federal Emergency Management Agency, 2018]. At the subnational scale, Puerto Rico has integrated social vulnerability into its CDBG Mitigation Action Plan, expanding its considerations of risk beyond only economic factors. At the local level, Harris County, Texas, has begun using social vulnerability indicators alongside traditional measures of flood risk to introduce equity into the prioritization of flood mitigation projects [<a href="https://www.hcfcd.org/Portals/62/Resilience/Bond-Program/Prioritization-Framework/final_prioritization-framework-report_20190827.pdf?ver=2019-09-19-092535-743" target="_blank" rel="noopener noreferrer"><em>Harris County Flood Control District</em></a>, 2019].</p><p>Unfortunately, many existing measures of disaster equity fall short. They may be unidimensional, using single indicators such as income in places where underlying vulnerability processes suggest that a multidimensional measure like racialized poverty (Figure 2) would be more valid. And criteria presumed to be objective and neutral for determining resource allocation, such as economic loss and cost-benefit ratios, prioritize asset value over social equity. For example, following the <a href="http://www.cedar-rapids.org/discover_cedar_rapids/flood_of_2008/2008_flood_facts.php" target="_blank" rel="noopener noreferrer">2008 flooding</a> in Cedar Rapids, Iowa, cost-benefit criteria supported new flood protections for the city's central business district on the east side of the Cedar River but not for vulnerable populations and workforce housing on the west side.</p><p>Furthermore, many equity measures are aspatial or ahistorical, even though the roots of marginalization may lie in systemic and spatially explicit processes that originated long ago like redlining and urban renewal. More research is thus needed to understand which measures are most suitable for which social equity analyses.</p>Challenges for Disaster Equity Analysis
<p>Across studies that quantify, map, and analyze social vulnerability to natural hazards, modelers have faced recurrent measurement challenges, many of which also apply in measuring disaster equity (Table 1). The first is clearly establishing the purpose of an equity analysis by defining characteristics such as the end user and intended use, the type of hazard, and the disaster stage (i.e., mitigation, response, or recovery). Analyses using generalized indicators like the CDC Social Vulnerability Index may be appropriate for identifying broad areas of concern, whereas more detailed analyses are ideal for high-stakes decisions about budget allocations and project prioritization.</p>Wisconsin will end its controversial wolf hunt early after hunters and trappers killed almost 70 percent of the state's quota in the hunt's first 48 hours.
By Jessica Corbett
Sen. Bernie Sanders on Tuesday was the lone progressive to vote against Tom Vilsack reprising his role as secretary of agriculture, citing concerns that progressive advocacy groups have been raising since even before President Joe Biden officially nominated the former Obama administration appointee.