
 568k
568k  233k
233k  41k
41k  Subscribe
 Climate Change: Everything You Need to Know


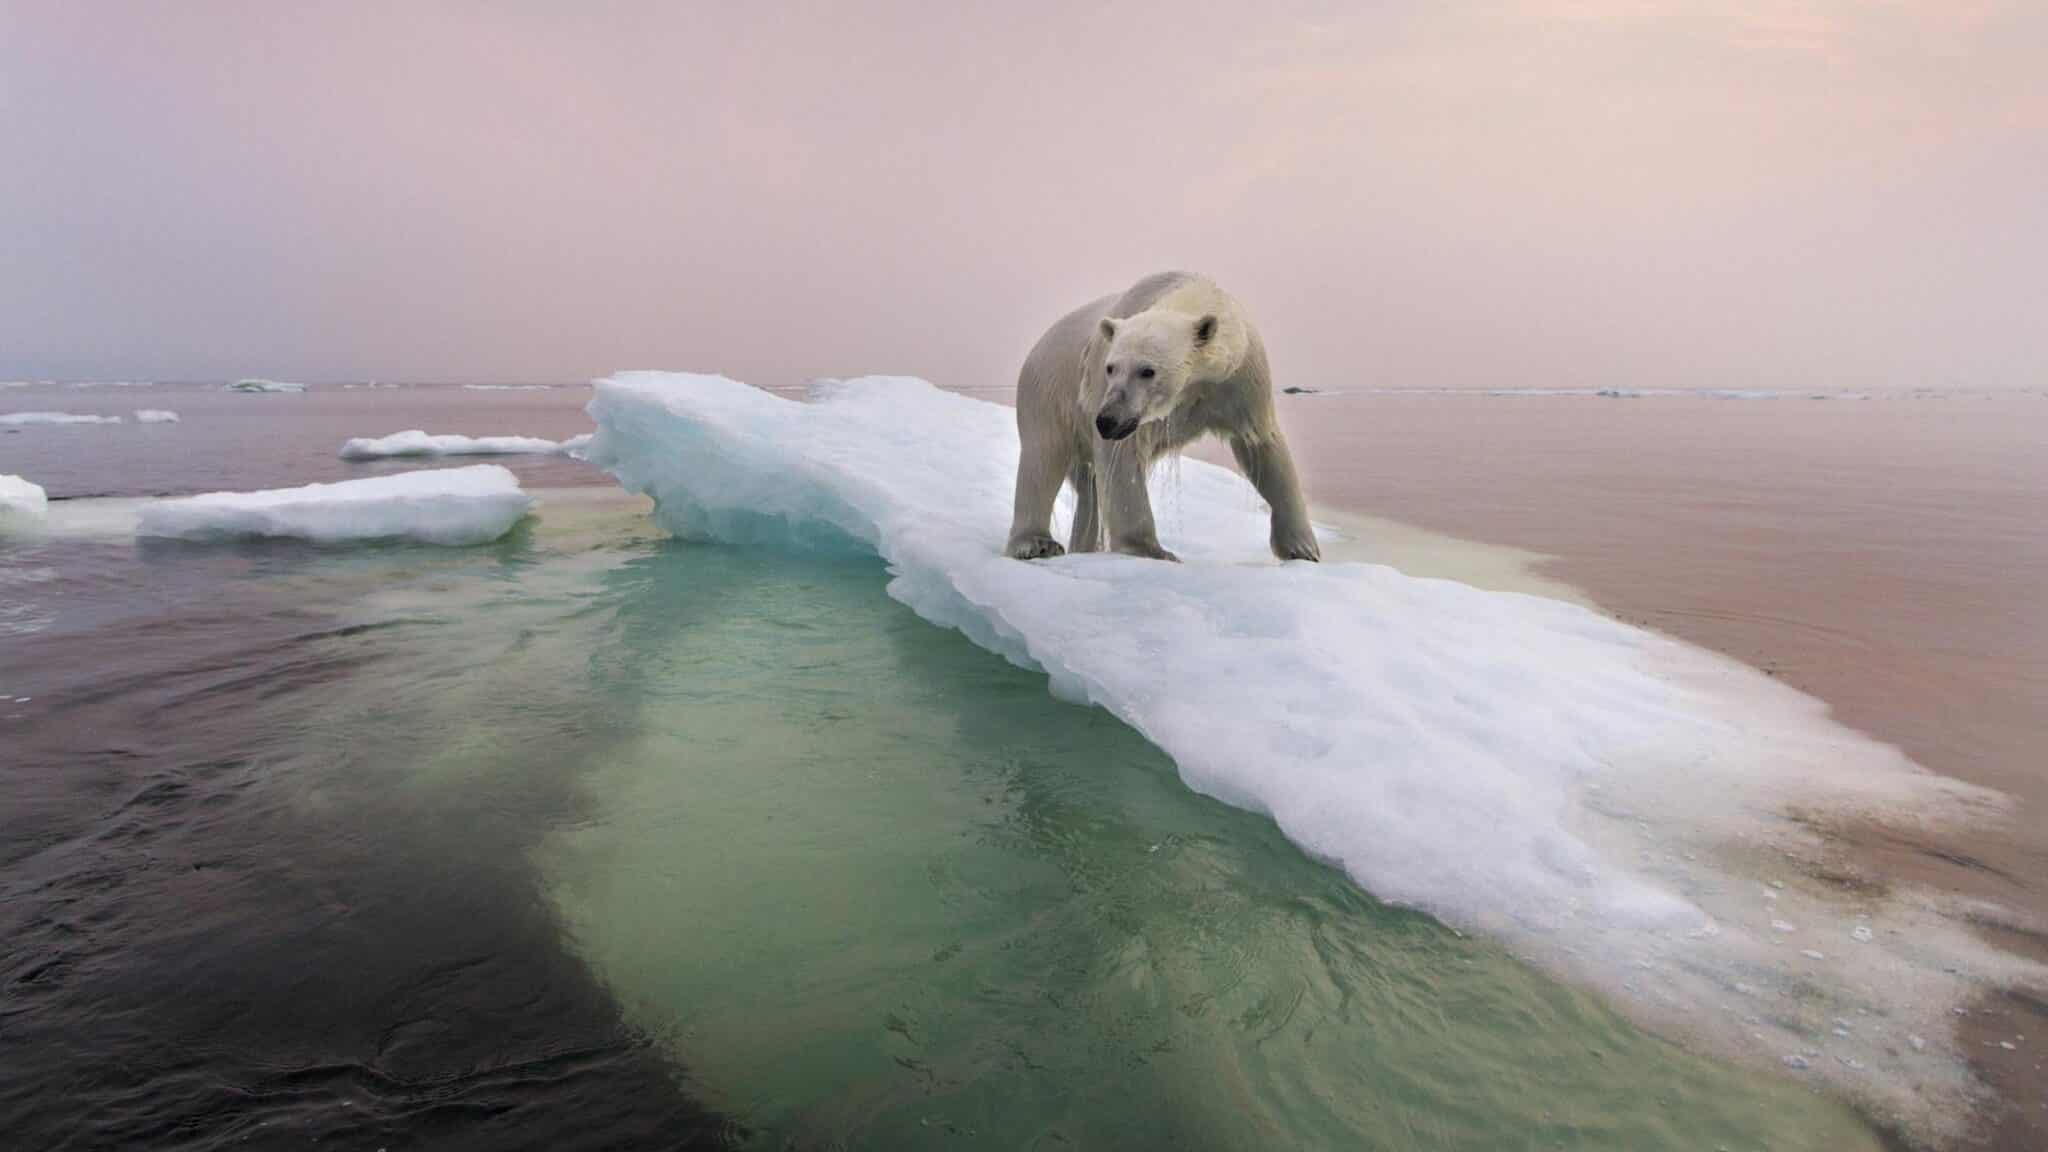
Paul Souders / Stone / Getty Images
 Why you can trust us
Founded in 2005 as an Ohio-based environmental newspaper, EcoWatch is a digital platform dedicated to publishing quality, science-based content on environmental issues, causes, and solutions.
What Is Climate Change? Is It Different From Global Warming?
Climate change is actually not a new phenomenon. Scientists have been studying the connection between human activity and the effect on the climate since the 1800s, although it took until the 1950s to find evidence suggesting a link.
Since then, the amount of greenhouse gases (carbon dioxide, methane, nitrous oxide and fluorinated gases) in the atmosphere have steadily increased, taking a sharp jump in the late 1980s when the summer of 1988 became the warmest on record. (There have been many records broken since then.) But climate change is not a synonym for global warming.
The term global warming entered the lexicon in the 1950s, but didn’t become a common buzzword until a few decades later when more people started taking notice of a warming climate. Except climate change encompasses a greater realm than just rising temperatures. Trapped gases also affect sea-level rise, animal habitats, biodiversity and weather patterns. For example, Texas’ severe winter storms in February 2021 demonstrate how the climate isn’t merely warming.
Why Is Climate Change Important? Why Does It Matter?
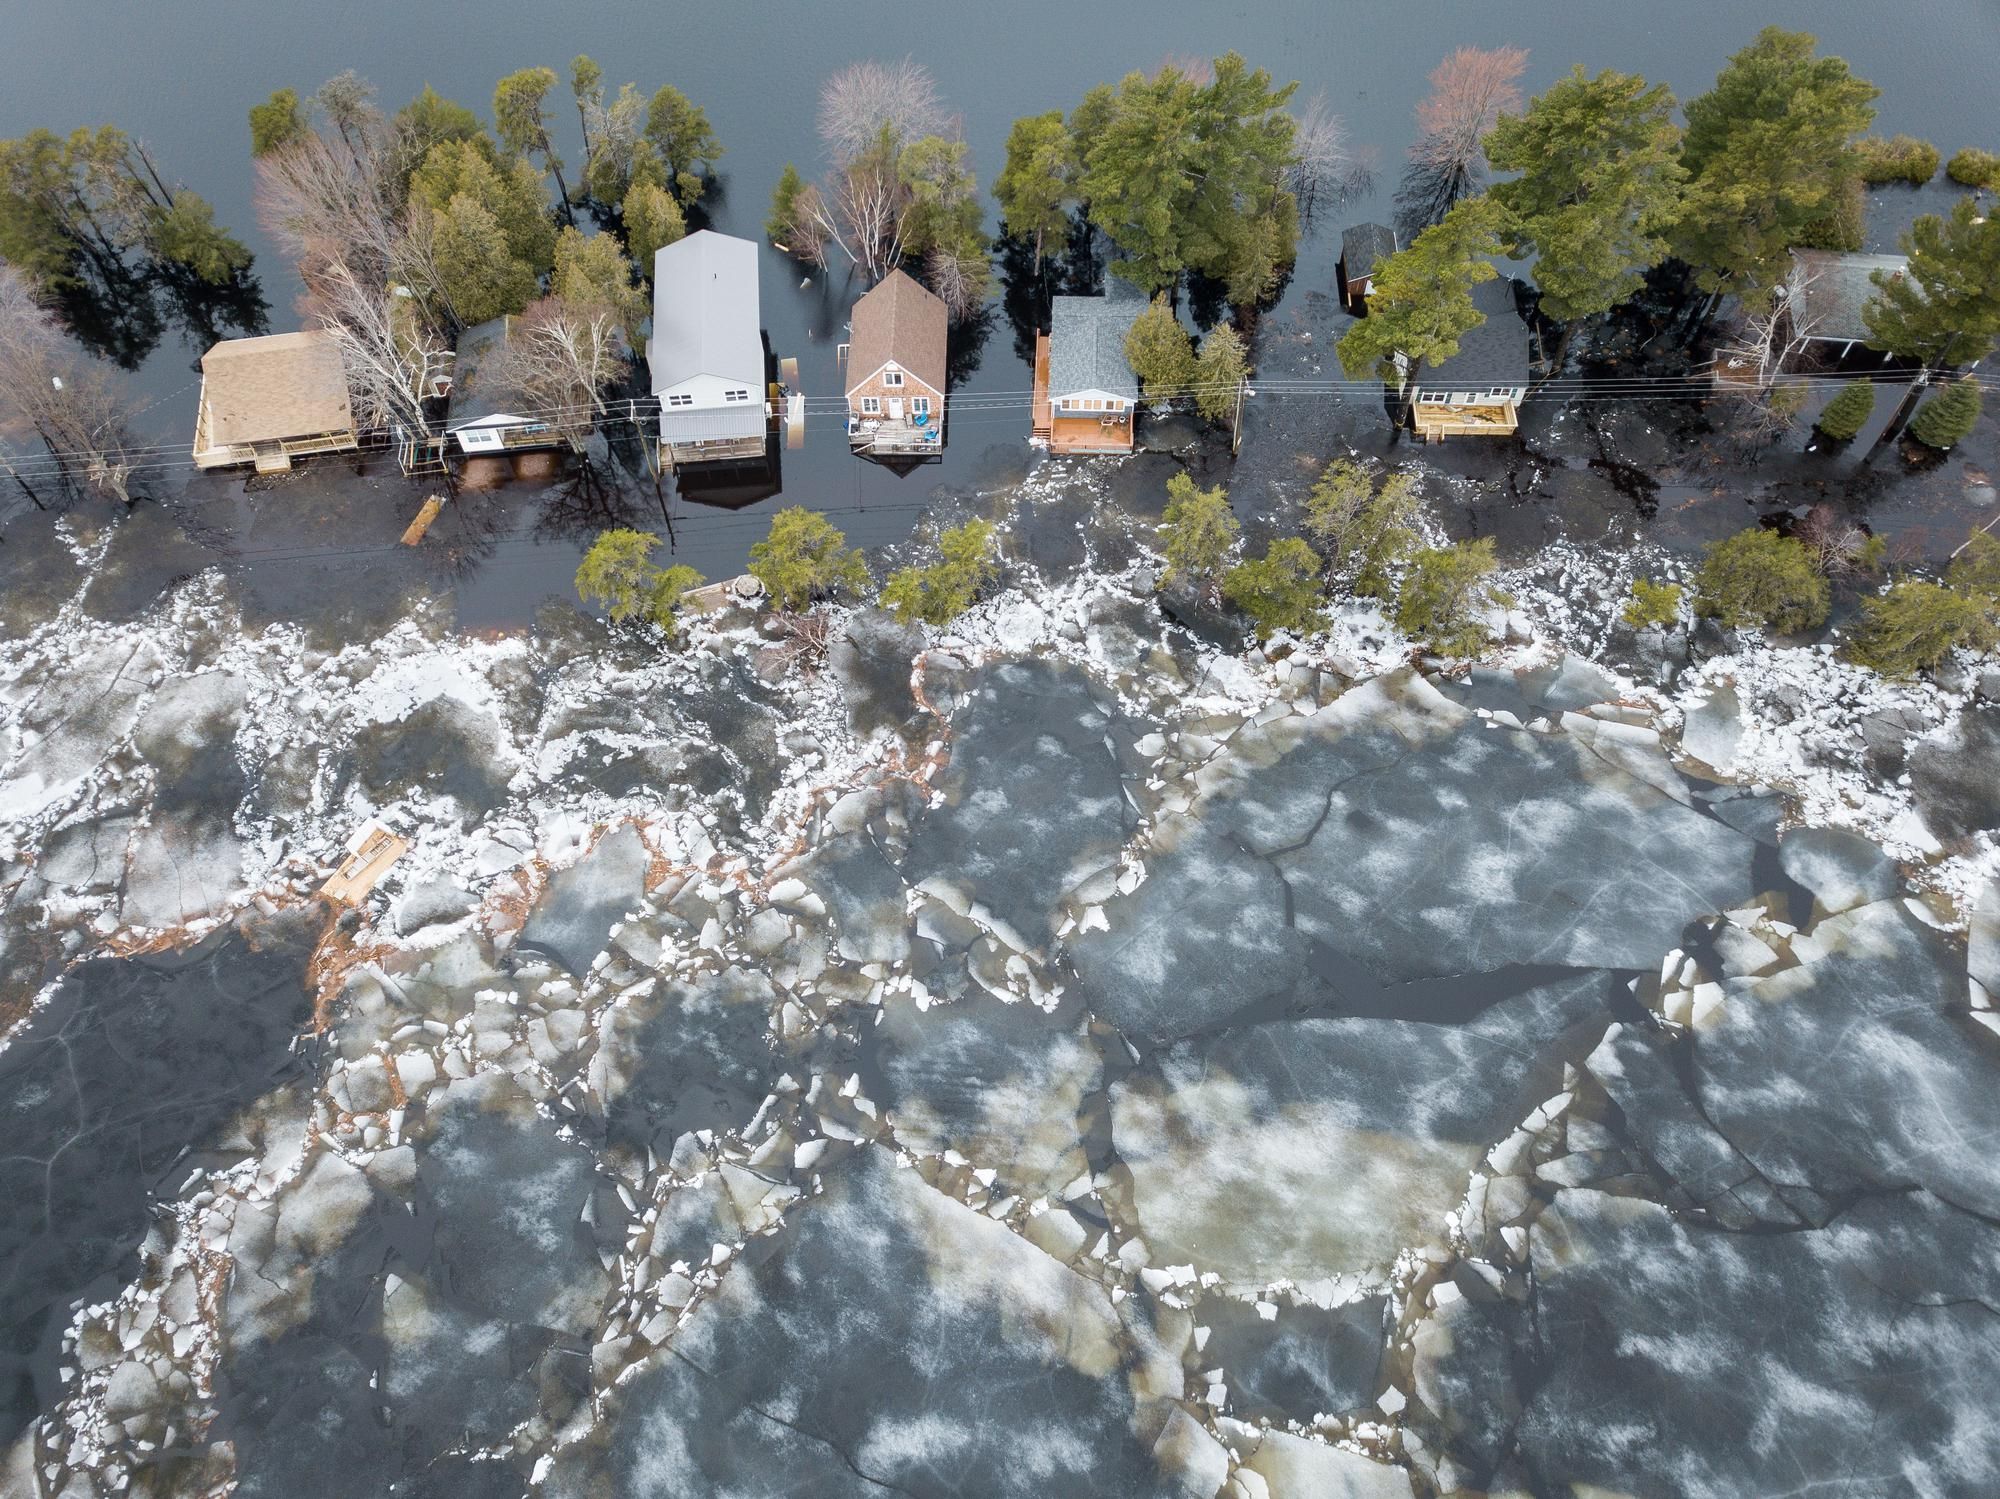
Marc Guitard / Moment / Getty Images
Despite efforts from forward thinkers such as SpaceX Founder Elon Musk to colonize Mars, Earth remains our home for the foreseeable future, and the more human activity negatively impacts the climate, the less habitable it will become. It’s estimated that Earth has already warmed about one degree Celsius, or two degrees Fahrenheit, since the start of the Industrial Revolution around the 1750s, although climate change tracking didn’t start until the late 1800s. That warming number may not sound like much, but this increase has already resulted in more frequent and severe wildfires, hurricanes, floods, droughts and winter storms, to name some examples.
Environmental Impacts
Then there’s biodiversity loss, another fallout of climate change that’s threatening rainforests and coral reefs and accelerating species extinction. Take rainforests, which act as natural carbon sinks by absorbing carbon dioxide from the atmosphere. But as rampant deforestation is occurring everywhere from Brazil’s Amazon to Borneo, fewer trees mean that rainforests are becoming carbon sources, emitting more carbon than they’re absorbing. Meanwhile, coral reefs are dying as warming ocean temperatures trigger bleaching events, which cause corals to reject algae, their main food and life source. Fewer trees, coral reefs and other habitats also equate to fewer species. Known as the sixth mass extinction, a 2019 UN report revealed that up to a million plant and animal species could become extinct within decades.
Human Impact
It can be easy to overlook climate change in day-to-day life, or even realize that climate change is behind it. Notice there’s yet another romaine lettuce recall due to E. Coli? Research suggests that E. Coli bacteria are becoming more common in our food sources as it adapts to climate change. Can’t find your favorite brand of coffee beans anymore? Or that the price has doubled? Climate change is affecting that too. Climate change is also worsening air quality and seasonal allergies, along with polluting tap water. Not least, many preliminary studies have also drawn a line between climate change and the deadly COVID-19 pandemic that is still gripping much of the world. Future pandemics are likely to happen more frequently until the root causes, such as deforestation, are addressed.
Speaking of larger-scale issues, global water scarcity is already happening more frequently. The Caribbean is facing water shortages due to rising temperatures and decreased rainfall; Australia’s dams may run dry by 2022 as severe wildfires increase and Cape Town, South Africa has already faced running out of water.
As touched upon earlier, it’s one thing to be inconvenienced by a lack of romaine lettuce for a couple of weeks or higher coffee bean prices, but reports warn how climate change will continue to threaten global food security, to the point of triggering a worldwide food crisis if temperatures surpass two degrees Celsius.
Many of these factors are already contributing to climate migration, forcing large numbers of people to relocate to other parts of the world in search of better living conditions.
Unless more immediate, drastic action is taken to combat climate change, future generations will have to contend with worst-case scenario projections by the end of the 21st century, not limited to coastal cities going underwater, including Miami; lethal heat levels from South Asia to Central Africa; and more frequent extreme weather events involving hurricanes, wildfires, tsunamis, droughts, floods, blizzards and more.
What’s Happening and Why?
The Earth’s temperature has largely remained stable until industrial times and the introduction of greenhouse gases. These gases have forced the atmosphere to retain heat, as evidenced by rising global temperatures. As the planet grows warmer, glaciers melt faster, sea levels rise, severe flooding increases and droughts and extreme weather events become more deadly.
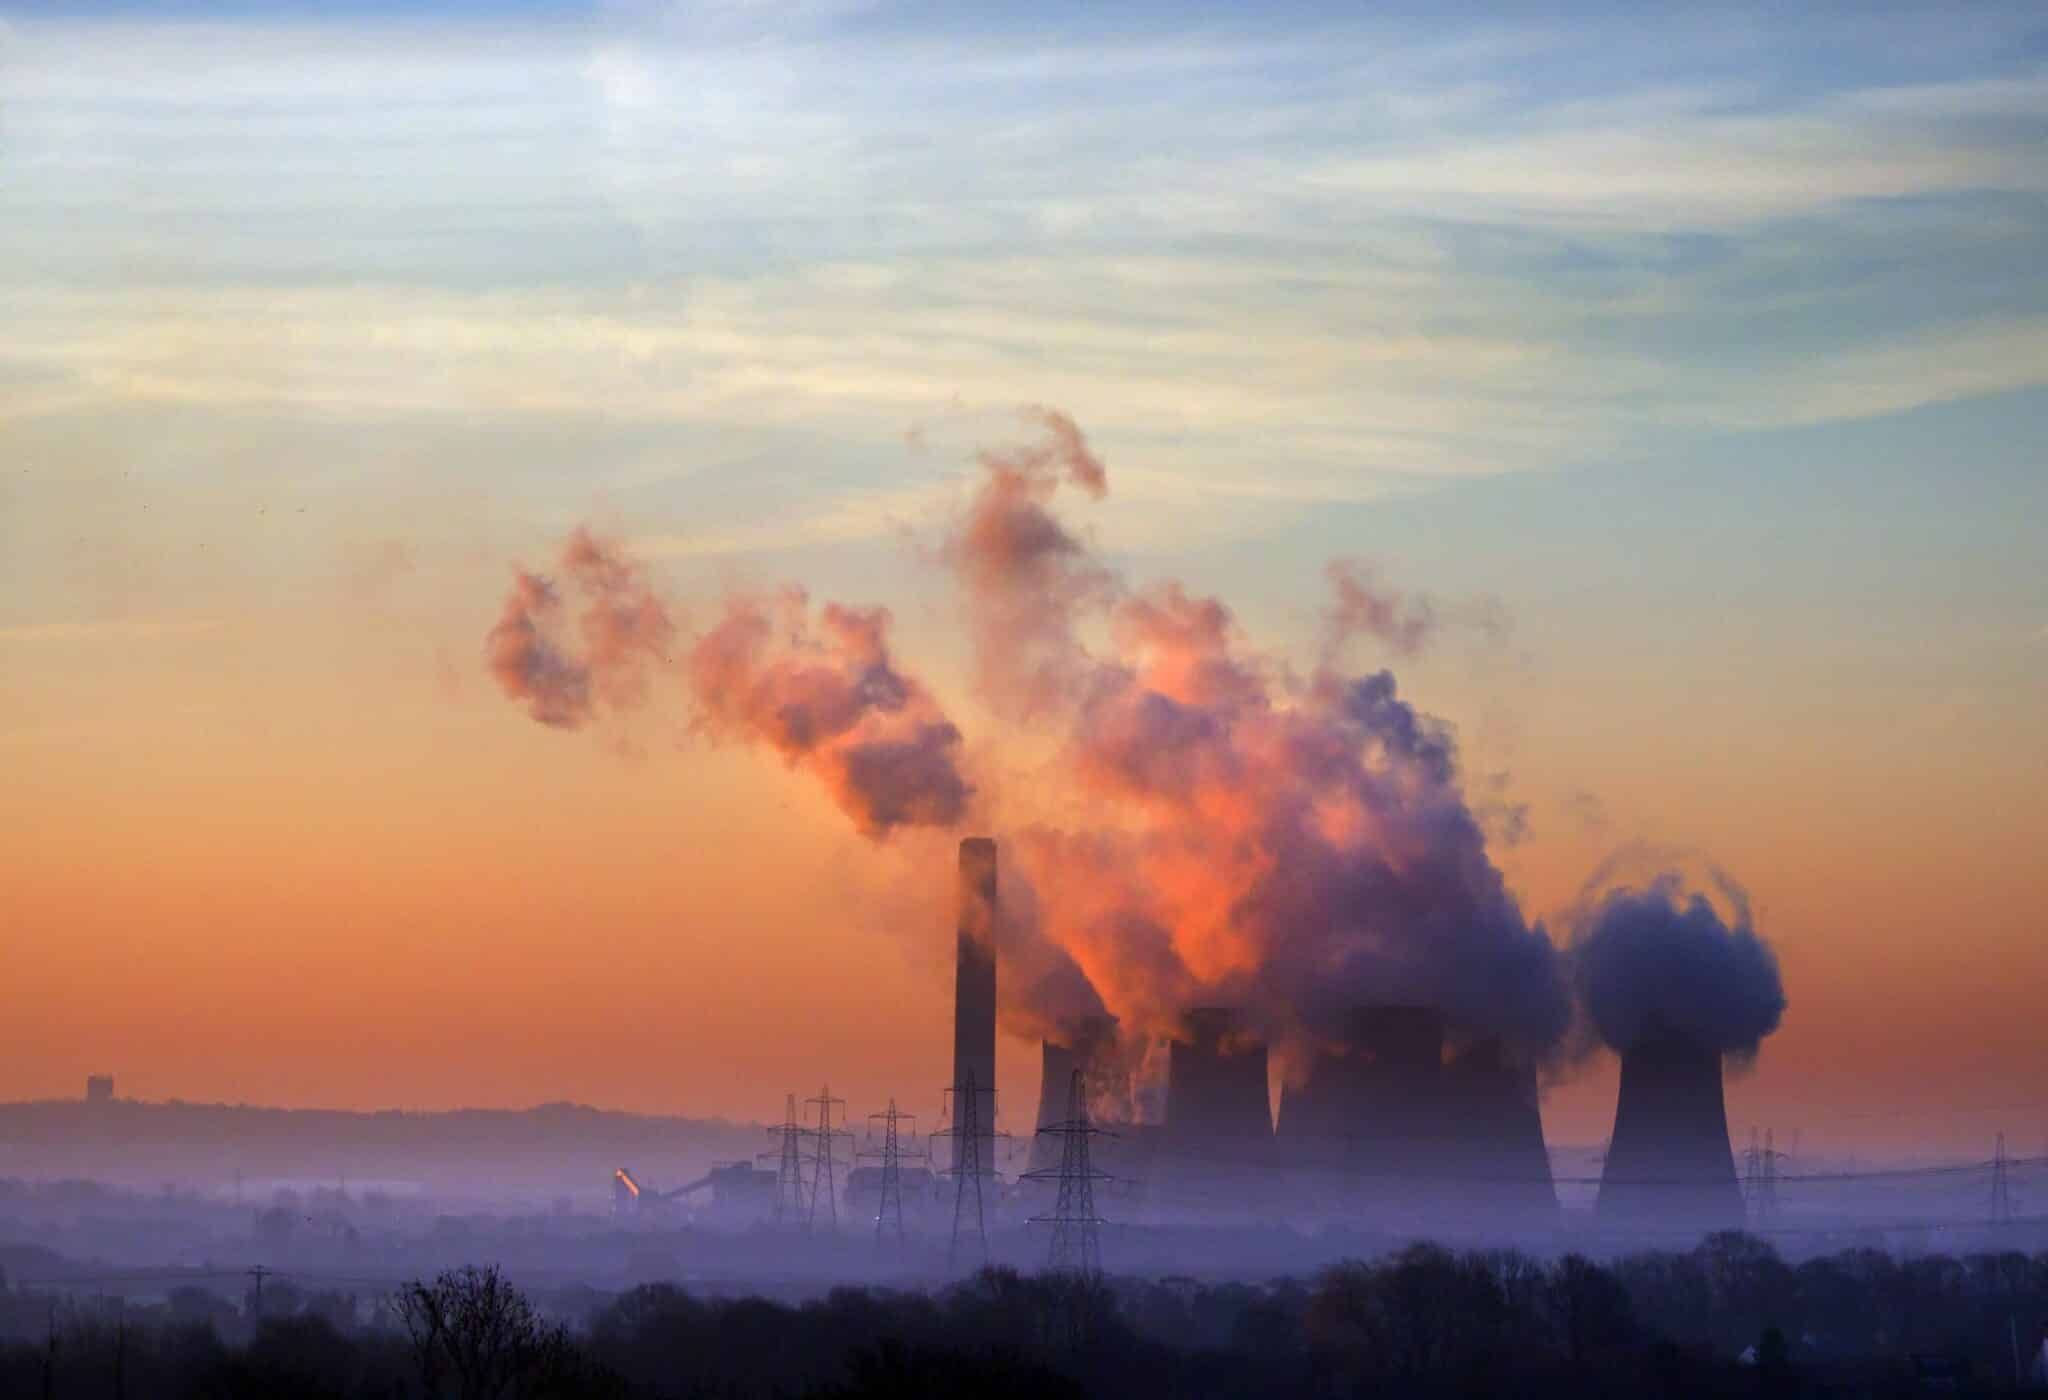
The Greenhouse Effect
In the late 1800s, Swedish chemist Svante Arrhenius studied the connection between the amount of atmospheric carbon and its ability to warm and cool the Earth, and while his initial calculations suggested extreme warming as carbon increased, researchers didn’t start to take human-induced climate change seriously until the late 20th century.
But proof of human-led climate change can be traced to the 1850s, and satellites are among the ways that scientists have been tracking increased greenhouse gases and their climate impact in more recent years. Climate researchers have also documented warmer oceans, ocean acidification, shrinking ice sheets, decreased snow amounts and extreme weather as among the events resulting from greenhouse gases heating the planet.
Numerous factors contribute to the production of greenhouse gases, known as the greenhouse effect. One of the biggest causes involve burning fossil fuels, including coal, oil and natural gas, to power everything from cars to daily energy needs (electricity, heat). From 1970-2011, fossil fuels have comprised 78 percent of total greenhouse gas emissions.
Big Ag is another greenhouse contributor, particularly beef production, with the industry adding 10 percent in 2019. This is attributed to clearing land for crops and grazing and growing feed, along with methane produced by cows themselves. In the U.S. alone, Americans consumed 27.3 billion pounds of beef in 2019.
Then there’s rampant deforestation occurring everywhere from the Amazon to Borneo. A 2021 study from Rainforest Foundation Norway found that two-thirds of the world’s rainforests have already been destroyed or degraded. In Brazil, deforestation reached a 12-year-high in 2020 under right-wing President Jair Bolsonaro. As it stands, reports predict that the Amazon rainforest will collapse by 2064. Rainforests are important carbon sinks, meaning the trees capture and remove carbon from the atmosphere. As rainforests collapse, the remaining trees will begin emitting more greenhouse gases than they’re absorbing.
Meanwhile, a recent study revealed that abandoned oil and gas wells are leaking more methane than previously believed, with U.S. wells contributing up to 20 percent of annual methane emissions.
Not least is the cement industry. Cement is heavily used throughout the global construction industry, and accounts for around eight percent of carbon dioxide emissions.
Natural Climate Change
Granted, natural climate change exists as well, and can be traced throughout history, from solar radiation triggering the Ice Ages to the asteroid strike that rapidly raised global temperatures and eliminated dinosaurs and many other species in the process. Other sources of natural climate change impacts include volcano eruptions, ocean currents and orbital changes, but these sources generally have smaller and shorter-term environmental impacts.
How We Can Combat Climate Change
While the latest studies and numbers can often feel discouraging about society’s ability to prevent the worst-case climate scenarios from happening, there’s still time to take action.
As a Society
In 2015 at COP 21 in Paris, 197 countries came together to sign the Paris Agreement, an international climate change treaty agreeing to limit global warming in this century to two degrees Celsius, and ideally 1.5 degrees Celsius, compared to pre-industrial levels; it’s believed that the planet has warmed one degree Celsius since 1750. Studies show that staying within the two-degree range will prevent the worst-case climate scenarios from happening. Achieving this goal requires participating parties to drastically slash greenhouse gas emissions sooner rather than later. However, there have already been numerous setbacks since then, from former U.S. President Donald Trump withdrawing from the Paris Agreement in 2020 to world leaders, such as China, the world’s biggest polluter, failing to enact aggressive climate action plans. Yet many of the treaty participants have been slow to implement changes, putting the world on track to hit 3.2 degrees Celsius by the end of the 21st century even if the initial goals are met. However, it’s worth noting that U.S. President Joe Biden rejoined the Paris Agreement in 2021, and pledged to cut greenhouse gases in half by 2030.
Then there’s the Montreal Protocol, a 1987 global agreement to phase out ozone-depleting substances such as chlorofluorocarbons, chemicals that were commonly used in air-conditioning, refrigeration and aerosols. Recent studies show that parts of the ozone are recovering, proving that a unified commitment to combatting climate change issues does make a difference.
On a smaller scale, carbon offset initiatives allow companies and individuals to invest in environmental programs that offset the amount of carbon that’s produced through work or lifestyle. For example, major companies (and carbon emitters) such as United Airlines and Shell have pledged to achieve net-zero carbon emissions in part by participating in carbon offset programs that remove carbon from the atmosphere. The problem is that these companies are still producing high levels of fossil fuel emissions.
While individuals can make a small impact through carbon offsets, the greater responsibility lies with carbon-emitting corporations to find and implement greener energy alternatives. This translates to car companies producing electric instead of gas vehicles or airlines exploring alternative fuel sources. It also requires major companies to rely more on solar and wind energy for their energy needs.
In Our Own Lives
While it’s up to corporations to do the heavy lifting of carbon reduction, that doesn’t mean individuals can’t make a difference. Adopting a vegan lifestyle, using public transportation, switching to an electric car and becoming a more conscious consumer are all ways to help combat climate change.
Veganism
Consuming meat relies on clearing land for crops and animals, while raising and killing livestock contributes to about 14.5% of global greenhouse gas emissions, according to the UN’s Food and Agricultural Organization. By comparison, choosing a plant-based diet could reduce greenhouse gas footprints by as much as 70 percent, especially when choosing local produce and products.
Public Transportation
Riding public trains, subways, buses, trams, ferries and other types of public transportation is another easy way to lower your carbon footprint, considering that gas-powered vehicles contribute 95 percent of transportation-related greenhouse gas emissions.
Electric Vehicles
Electric cars and trucks have come down in price as more manufacturers enter the field, and these produce far lower emissions than their gas counterparts. Hybrid vehicles are another good alternative for lowering individual emission contributions.
Conscious Consumption
Buying locally produced food and items is another way to maintain a lower carbon footprint, as the products aren’t shipped or driven long distances. Supporting small companies that are committed to sustainability is another option, especially when it comes to clothes. Fast fashion has become a popular option thanks to its price point, but often comes at the expense of the environment and can involve unethical overseas labor practices. Not least, plastic saturates every corner of the consumer market, but it’s possible to find non-plastic alternatives with a little research, from reusable produce bags to baby bottles.
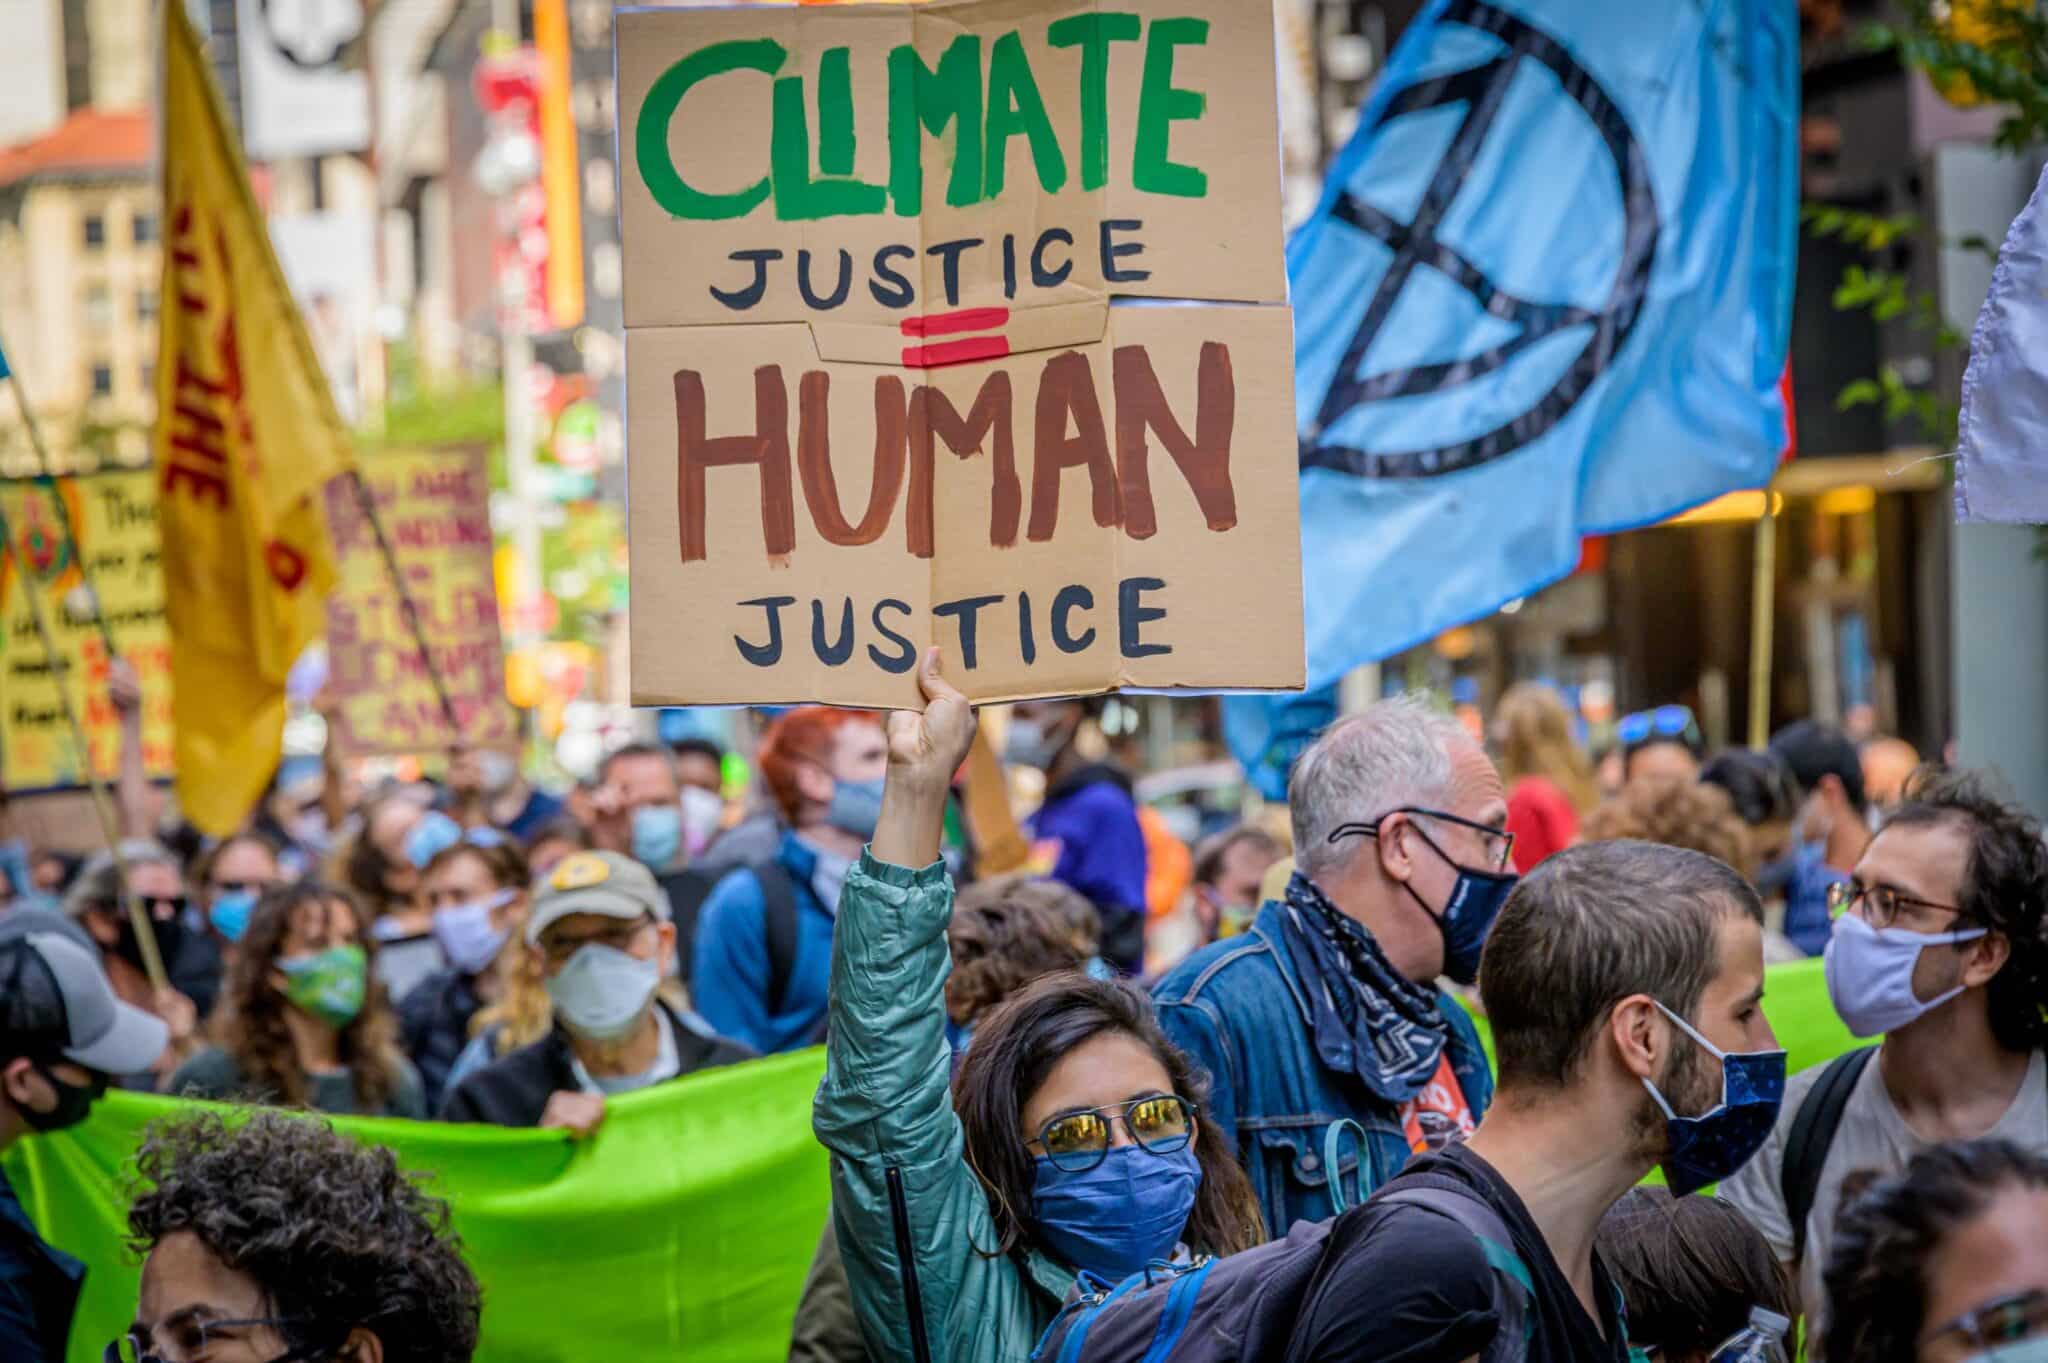
Climate Activism
Those interested in becoming even more involved can join local climate action organizations. Popular groups include the Sunrise Movement, Fridays for Future, Greenpeace and the Sierra Club, to name a few. Voting, volunteering, calling local representatives and participating in climate marches are additional ways to raise your voice.
Takeaway
It’s taken centuries to reach a climate tipping point, with just a matter of decades left to prevent the worst-case climate scenarios from happening. But there’s still hope of controlling a warming climate as long as individuals, companies and nations make an immediate concerted effort to lower greenhouse gas emissions. As the world already experienced with the COVID-19 pandemic, a rapid unified response can make all the difference.
Meredith Rosenberg is a senior editor at EcoWatch. She holds a Master’s from the Newmark Graduate School of Journalism in NYC and a B.A. from Temple University in Philadelphia.
Editorial note: This article was originally published on May 5, 2021.
- Climate Change Likely Drove Our Ancestors to Extinction, Study ...
- Climate Change Made Earth-like Venus Uninhabitable - EcoWatch
- 4 Reasons the Paris Agreement Won't Solve Climate Change ...
- Fighting Climate Change Is a Social Justice Issue Too - EcoWatch
- Millennials: Climate Change Is World's Biggest Problem - EcoWatch
- Human Activity Linked to Extreme Rainfall
- Rock Climbing Legend Alex Honnold Wants You to Stop Funding the Climate Crisis
- 2021 Summer Weather Disasters Strike 30% of Americans, So Far
- World’s Largest Carbon Capture Plant Begins Running in Iceland
- 11 Best Books About the Environment [Including Kids Books] - EcoWatch
Subscribe to get exclusive updates in our daily newsletter!
By signing up, you agree to the Terms of Use and Privacy Policy & to receive electronic communications from EcoWatch Media Group, which may include marketing promotions, advertisements and sponsored content.