
 568k
568k  233k
233k  41k
41k  Subscribe

The decline of Arctic sea ice is already setting records in 2016, with the winter peak in March clocking in as the lowest since satellite records began, scientists say.
A new and fuller summary of this year’s Arctic winter by the U.S. National Snow and Ice Data Centre (NSIDC) confirms the preliminary announcement last week that sea ice reached its annual maximum extent on March 24 this year.

Covering an area of 14.52m square kilometers, this year’s peak winter extent is a shade smaller than the previous record low set in 2015. But the new NSIDC report adds a lot more detail about what it calls a “highly unusual” and “most interesting” Arctic winter.
With abnormally warm conditions right across the Arctic, some regions experienced temperatures 4-8C higher than average. While this meant slower ice growth in some places, in others it caused a dramatic thinning by 30cm in one week, according to early model results.
Reaching a Peak
Arctic sea ice ebbs and flows with the seasons, reaching a maximum extent for the year in February or March and a minimum in September, at the end of the summer melt period.
This year, scientists were still waiting expectantly at the end of March, explains the NSIDC report:
“Very early in the month, extent declined, raising anticipation that an early maximum had been reached. However, after a period of little change, extent slowly rose again, reaching the seasonal maximum on March 24.”
As late as a week ago, scientists still hadn’t ruled out the possibility of a late season surge. But sea ice extent has dropped off quite a bit since then, suggesting the peak has been and gone.
You can see this year’s sea ice behavior in the graph below from NSIDC, which shows sea ice extent over the 2015/6 winter (blue line) up to April 3 compared to previous years.

Record Low?
Arctic sea ice’s indecisive behavior throughout March meant it finally reached its maximum extent quite late in the year, 12 days later than the 1981-2010 average.
This isn’t significant in itself, says NSIDC, since the timing of the winter maximum can vary quite a lot from year to year, occurring as early as February 24 in 1996 or as late as April 2 in 2010.
This year’s winter peak reached 14.52m square kilometers or 1.12m square kilometers below the 1981-2010 average (compare the blue line with the grey line in the graph above).
At 13,000 square kilometers under the previous record set in February 2015, this year bears the title of smallest winter maximum on record by only the slimmest of margins.
In fact, it’s within the margins of error that NSIDC uses to estimate sea ice extent, says Prof. Andrew Shepherd, professor of earth observation at the University of Leeds.
Technically-speaking, that means 2016 ties with 2015 for the lowest winter peak on record, he tells Carbon Brief.
But what about the winter as a whole?
This Winter in Context
A number of factors influence sea ice cover from year to year, so the value for any month, season or year isn’t necessarily smaller than the previous one.
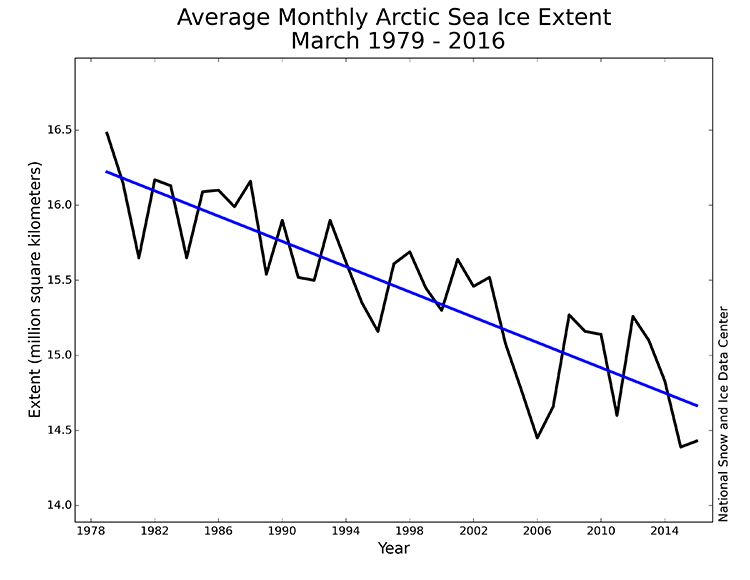
That said, Arctic sea ice in January was lower in 2016 than in any previous year. The same was true for February. March 2016 saw the second lowest sea ice extent in the satellite record (which dates back to 1979), says NSIDC, with 40,000 square kilometers more ice than the previous record set in 2015.
You can see the annual ups and downs in March sea ice extent in the graph below (black line). The trend over time, however, is clearly downwards. The blue line shows the decline in March sea ice extent of 2.7 percent per decade since 1979.
Unusual Warmth
What’s behind this winter’s low ice extent?
The Arctic is warming more than twice as fast as the global average, largely in response to rising greenhouse gases.
In March 2016, nearly all of the Arctic Ocean experienced exceptionally warm conditions, says the NSIDC report, with air temperatures about 3,000 feet above the surface typically 2 to 4C higher than the long term average.
This is consistent with what scientists have been seeing for the last few months, Dr. Ruth Mottram, a climate scientist at the Danish Meteorological Institute, tells Carbon Brief:
“It has been a pretty unusual winter with a lot warmer temperatures than usual, especially over Greenland, Svalbard and the Canadian Arctic. We had a brief cold spell for a couple of weeks in February over Greenland, but, otherwise, temperatures have been well above average.”
Temperatures nearer the Pole reached as high as 4-8C warmer than usual, the NSIDC report explains:
“As an exclamation point on the unusual warmth, there was a brief weather event at the very end of December 2015 when air temperatures near the Pole nearly reached the melting point.”
The strange December weather event also caused high temperatures in the Kara and Barents Seas, the report notes. According to the PIOMAS model which estimates sea ice thickness, sea ice in this region thinned by up to 30cm in the week between Dec. 28, 2015 and Jan. 4 (blue shading in the map below).

As well as the ongoing human-induced warming trend in the Arctic, the report attributes some of the particularly low sea ice extent in the Kara and Barents Seas tothe influx of warm Atlantic waters to the region.
But the scientists’ efforts to unravel the many different contributions to such unusual warmth across the Arctic are still ongoing, the report adds:
“The reasons for the persistent warmth over the entire Arctic this past winter are currently under investigation; a link with the strong El Niño pattern of this winter may be involved.”
While the unusual warmth across the Arctic “helped to keep ice extent especially low” over winter, according to the NSIDC report, it’s likely there were other factors at play, too. Prof. Julienne Stroeve, a senior research scientist at NSIDC, tells Carbon Brief:
“The slow ice growth is in part from warmer than normal air temperatures in the Arctic, but also winds that have helped to keep ice in the Barents Sea from expanding southwards.”
Sea Ice Thickness
Monitoring the health of sea ice in the Arctic means knowing about how ice thickness has fared this winter as well as extent—and the winter isn’t over yet on that front, says Shepherd. He tells Carbon Brief:
“Although NSIDC’s data show that the peak extent of Arctic sea ice this winter tied with the record low of 2015, we know that ocean water continues to freeze on to the ice base through April.”
The latest observations of sea ice thickness from the CryoSat satellite show that the ice was, on average, 1.8m thick in March, says Shepherd. This is about 10cm thinner than the same time last year, but about 10cm thicker than the record winter low in 2013.
Shepherd and his team will use measurements of thickness together with sea ice extent to estimate the volume of ice left at the end of winter. These results aren’t public yet, but Shepherd tells Carbon Brief it’s not looking hopeful:
“If things continue as in previous years, I suspect this year could see a tie with that record low for volume as well, but it’s too early to say for sure.”
Less Old Ice, More Young Ice
Monitoring sea ice thickness can tell us about the age of the ice that’s left in the Arctic, as well as how it’s changing over short timescales. The oldest ice—more than five years old—is now at record low levels, making up just 3 percent of the total ice cover, according to the NSIDC report.
Of the sea ice in the Arctic basin, 70 percent is first-year ice (which means it’s melting and refreezing each year) while only 30 percent is lasting through one summer without melting.
The map below shows the age of sea ice across the Arctic for a week at the start of March. Red is the very old (5+ years) ice in the western Beaufort Sea, while dark blue is first year ice.
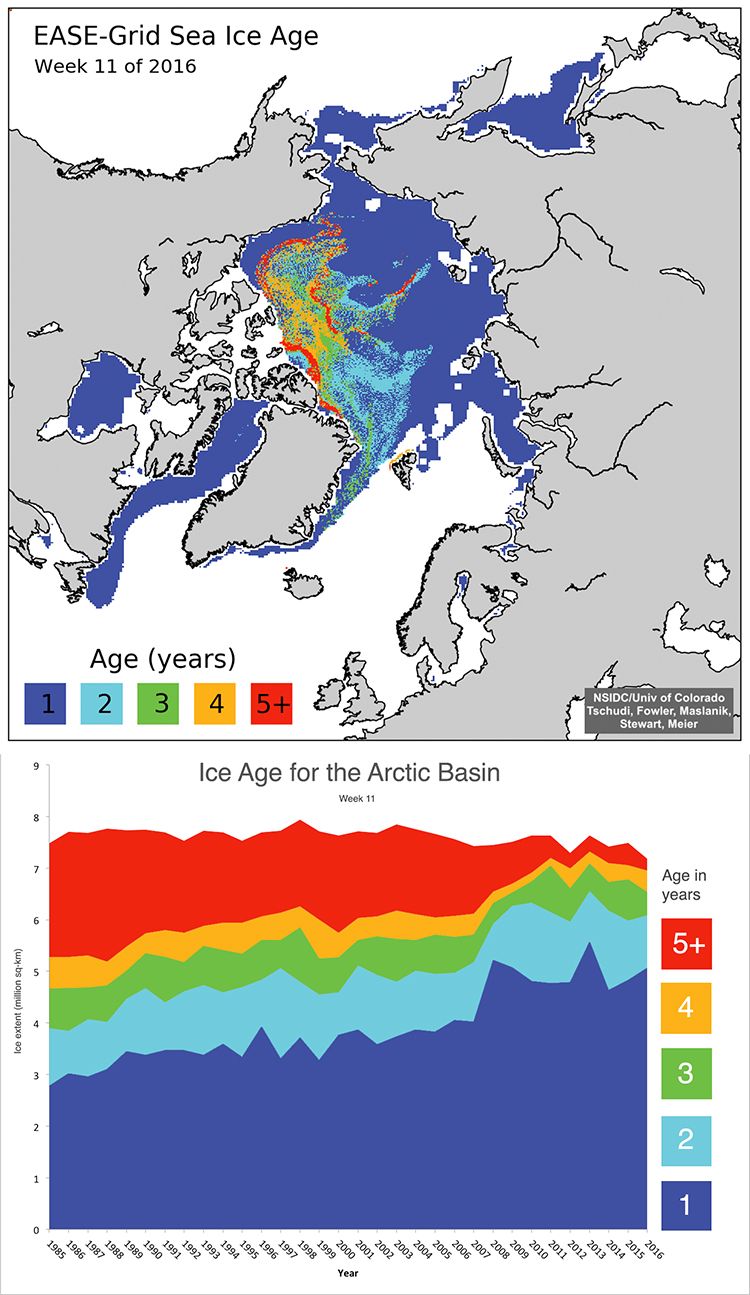
The bottom graph shows how the amount of ice of different ages has changed over time for that same week in March. Very old ice (red) is showing no signs of recovery, says NSIDC, with little change since the end of a strong five-year decline in 2012. The report says:
“The bottom line is that ice no longer survives in the Arctic for very long. It is lasting three to four years tops before melting or advecting out through Fram Strait. This is a big change from the past when much of the ice cover would survive upwards of a decade.”
Outlook for 2016
Scientists are quick to point out that while this year’s winter peak is at the low end of the scale, it doesn’t necessarily mean 2016 as a whole will break records for low ice cover.
How high or low ice cover reaches at the end of summer will depend a lot on when the melt season gets underway, how long it lasts and how other weather conditions conspire to strengthen or weaken the ice. But the fact that the ice is thin after a warm winter suggest it is starting on a vulnerable footing, Stroeve tells Carbon Brief:
“The Arctic is warmer than it used to be, the melt season starts earlier and ends later and all this helps to keep the summer ice cover low.”
YOU MIGHT ALSO LIKE
5 Island Nations That Could Completely Dry Up This Month
Half of World Heritage Sites at Risk From Fossil Fuel Development and Other Industries
Climate Change + Population Growth + Economic Expansion = More Severe Flooding
Climate Model Predicts Melting of West Antarctic Ice Sheet Could Double Sea Level Rise